2024-25 Hudson Valley Winter Outlook
It’s that time of the year: winter outlook season is here ☃️
My winter outlook is typically my most popular post of the year. And for good reason. You’re here because you want to know if there’s going to be a lot of snow days this winter, right? 😁
My first encounter with snow days that I can remember happened in January 1996 when a big blizzard struck the Northeast. Do you remember it? That storm left such a mark that I became a snow day ‘connoisseur’ of sorts, always craving the next big one. The 2000s had a couple of good Hudson Valley winters that kept my interest growing. And I’m still here, even though we haven’t had a big winter for a little while. Now that I’m returning to the region, I look forward to experiencing snow day magic once again!
2024-25 winter outlook meet 2024-25 BenNollWeather merch 🤝
This year’s merch offers a couple of new looks. There’s four styles to choose from: snow day tomorrow, snow globe, and two different BenNollWeather emblems. There will be no doubt who you get your snow day predictions from 😇
🔗 Link to new merch: https://bennollstore.com/collections/bnw-2024-25
Your support keeps the predictions going all season long. Thank you in advance!
Before we get to the outlook, you should get familiar with this story’s main characters:
📖 In this tale of winter weather, La Niña takes the lead. The other characters—each with their own strengths and quirks—either align with or oppose La Niña, creating a complex dance of forces.
La Niña (protagonist): La Niña cools the Pacific, tends to bring high pressure to the southern U.S., and reduces moisture availability to eastern storms. Its influence weakens the sub-tropical jet stream, generally lowering the chance for nor’easters.
Sub-tropical jet stream (supporting character): The sub-tropical jet stream loses strength under La Niña, typically leading to fewer opportunities for big storms.
Warm North Pacific / cold West Coast seas (supporting character): These seas draw stormy, cold weather to the western U.S., diverting it from the East Coast.
Warm Atlantic seas (antagonist/foiling character): The warm Atlantic seas are a wildcard, potentially fueling strong storms if the right ingredients come together and countering La Niña’s drying effects.
Polar jet stream (antagonist/foiling character): Enhanced during La Niña winters, the polar jet stream brings cold air and can spawn fast-moving clipper systems, which bring a few inches of snow and an icy chill before quickly departing, adding another layer of complexity to the winter narrative.
Each character adds their own twist to the winter narrative, creating a season full of surprises and shifting dynamics.
🖊️ It’s time to turn the page. As far as snow goes…
The trend is not our friend 📉
Modern winters just aren’t as bad as the ones your grandparents faced. It’s a function of warmer temperatures, less frequent extreme cold, and a slight trend toward less snow. It doesn’t mean that a “really bad” winter isn’t possible in 2024-25, but you probably wouldn’t want to bet on it.
The 2014-15 winter is the most recent example of a “winter of old”, when in February 2015 the dreaded polar vortex descended on the U.S. and brought bone-chilling, sub-zero temperatures for weeks on end.
The plot below is an illustration of Hudson Valley “winter severity stripes” since 1940. In this case, severity is calculated by combining winter temperatures, wind, and snowfall.
Blue stripes indicate harsh winters while red stripes highlight mild ones. The most recent winters are on the far right. Clearly, with the increasing frequency of red coloring, winters aren’t what they used to be. The last blue stripe was in winter 2014-15, implying that the last decade of winters haven’t been particularly bad in the Hudson Valley.

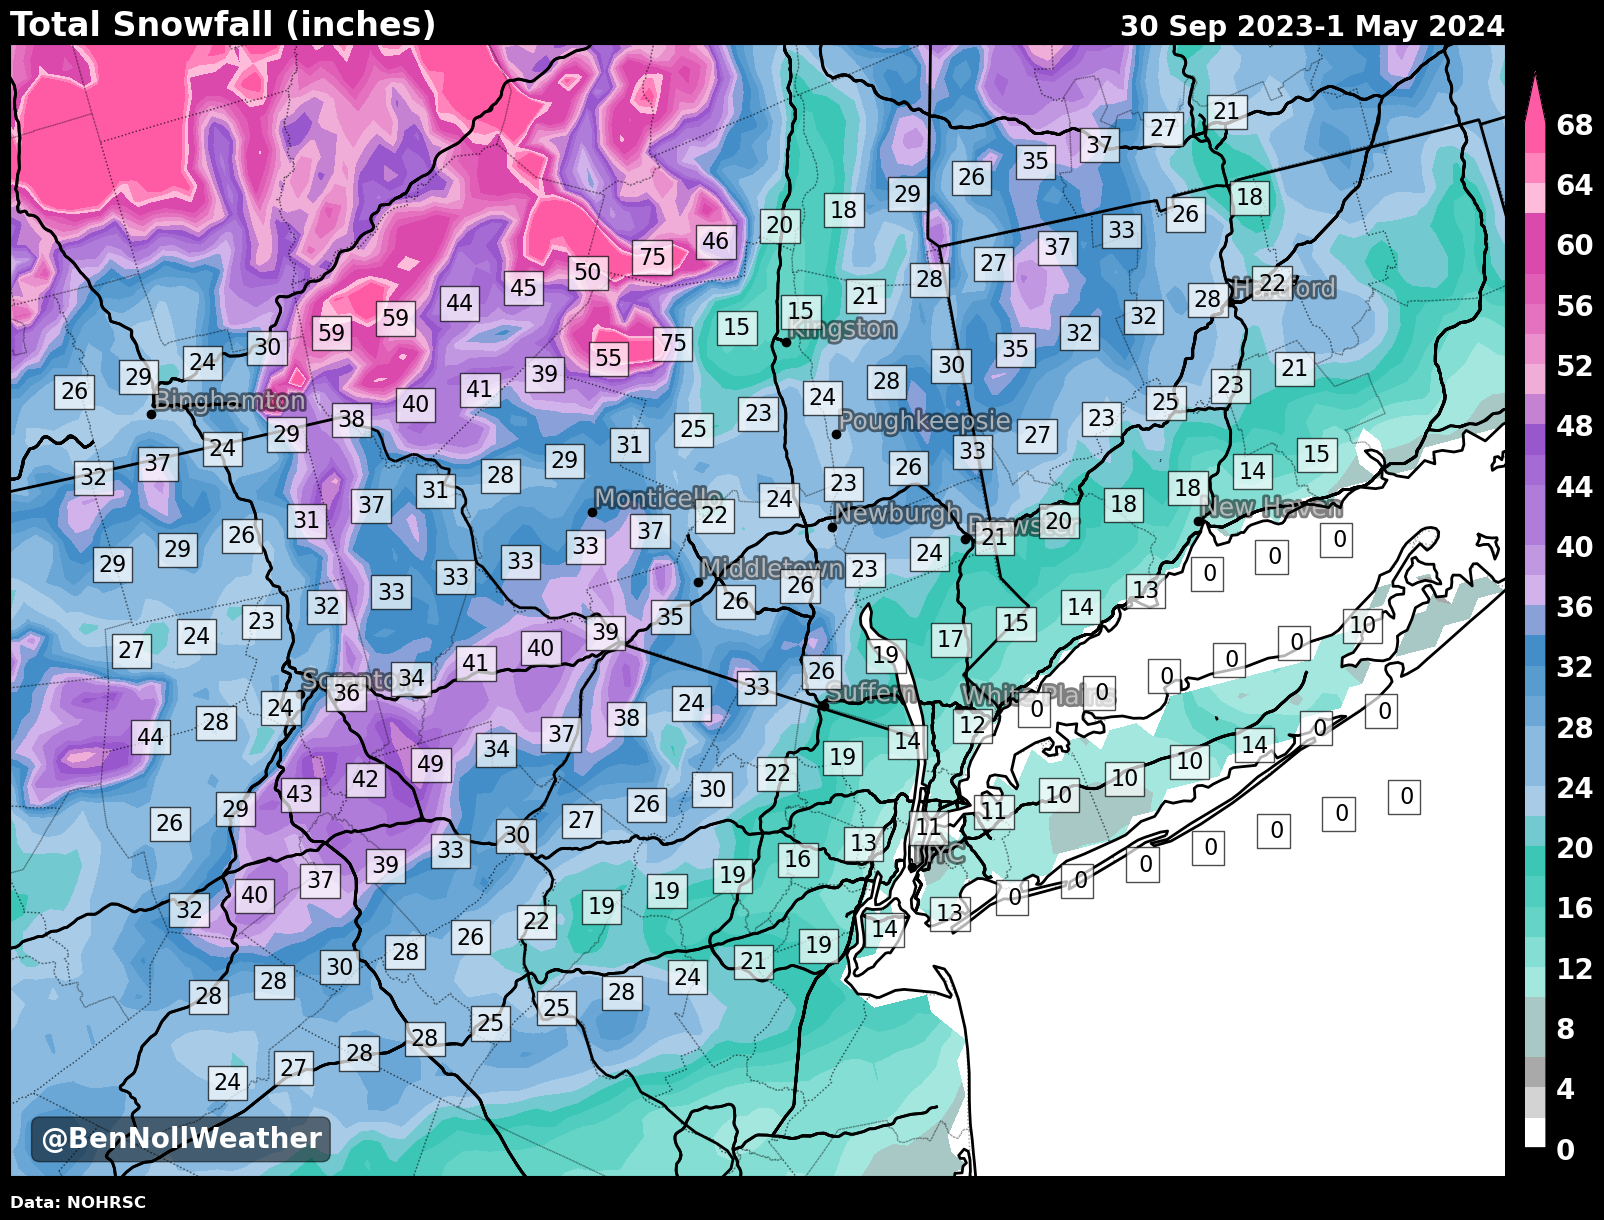
Last winter, snowfall was generally about 50-75% of normal across the Hudson Valley, with amounts ranging from 15 inches in the lower portion of the region to 35 inches in the Catskills.
The season was dramatically influenced by El Niño, which led to an enhancement of the sub-tropical jet stream, sending mild, moist air into the Mid-Atlantic and Northeast — good for rain, but not for snow.
But this winter, we won’t have El Niño
As previously mentioned, La Niña will be an important climate driver this winter. Between 2020-2023, back-to-back-to-back La Niña events unfolded, comprising a rare “triple dip”. We can draw on experiences during those winters to help build the narrative for winter 2024-25.
The chart below shows how snowfall tracked through each of the three La Niña winters, compared to normal (red line).
Accumulating snow fell in one of three La Niña Novembers. On average, the first inch of the snow falls during the first week of December in the Hudson Valley.
Recent La Niña winters had between 1-13 inches of snow in December, 6-13 inches in January, 5-33 inches in February, and 0 to 16 inches in March. Quite a mixed bag! January was the most consistently snowy month.
The big standout during these winters was 33 inches in February 2021. This was influenced by a southward migration of the polar vortex early that year — a wildcard factor that can’t be relied upon to occur every winter.
The average of the three recent La Niña winters gives us 40 inches — just about equaling the long-term seasonal snowfall average for the mid-Hudson Valley.
I think this is a reasonable ceiling for the upcoming season, particularly given what we’ll explore in the next section, which is the latest model forecasts and trends.
What happens when we look further back, considering all La Niña events back to 1940? The map below shows the chance for above normal snowfall during a La Niña winter. For the Hudson Valley, only 3 or 4 out of every 10 La Niña winters have above normal snowfall (30 to 40% chance).
What the models are saying
It has been said that all models are wrong but some models are useful.
The models were indeed useful last winter, suggesting that below normal snowfall was the most likely outcome. But past performance does not guarantee future success and seasonal forecasts typically only have a hit rate of 40% to at most 60%. This is important to keep in mind as you explore the maps below. That said, these state-of-the-art machines are the best tools we have. Mother Nature always has the last word with her random, chaotic ways, but we can try (key word: try!) to predict her path 🚶♀️
Let me reintroduce the characters in this story:
La Niña
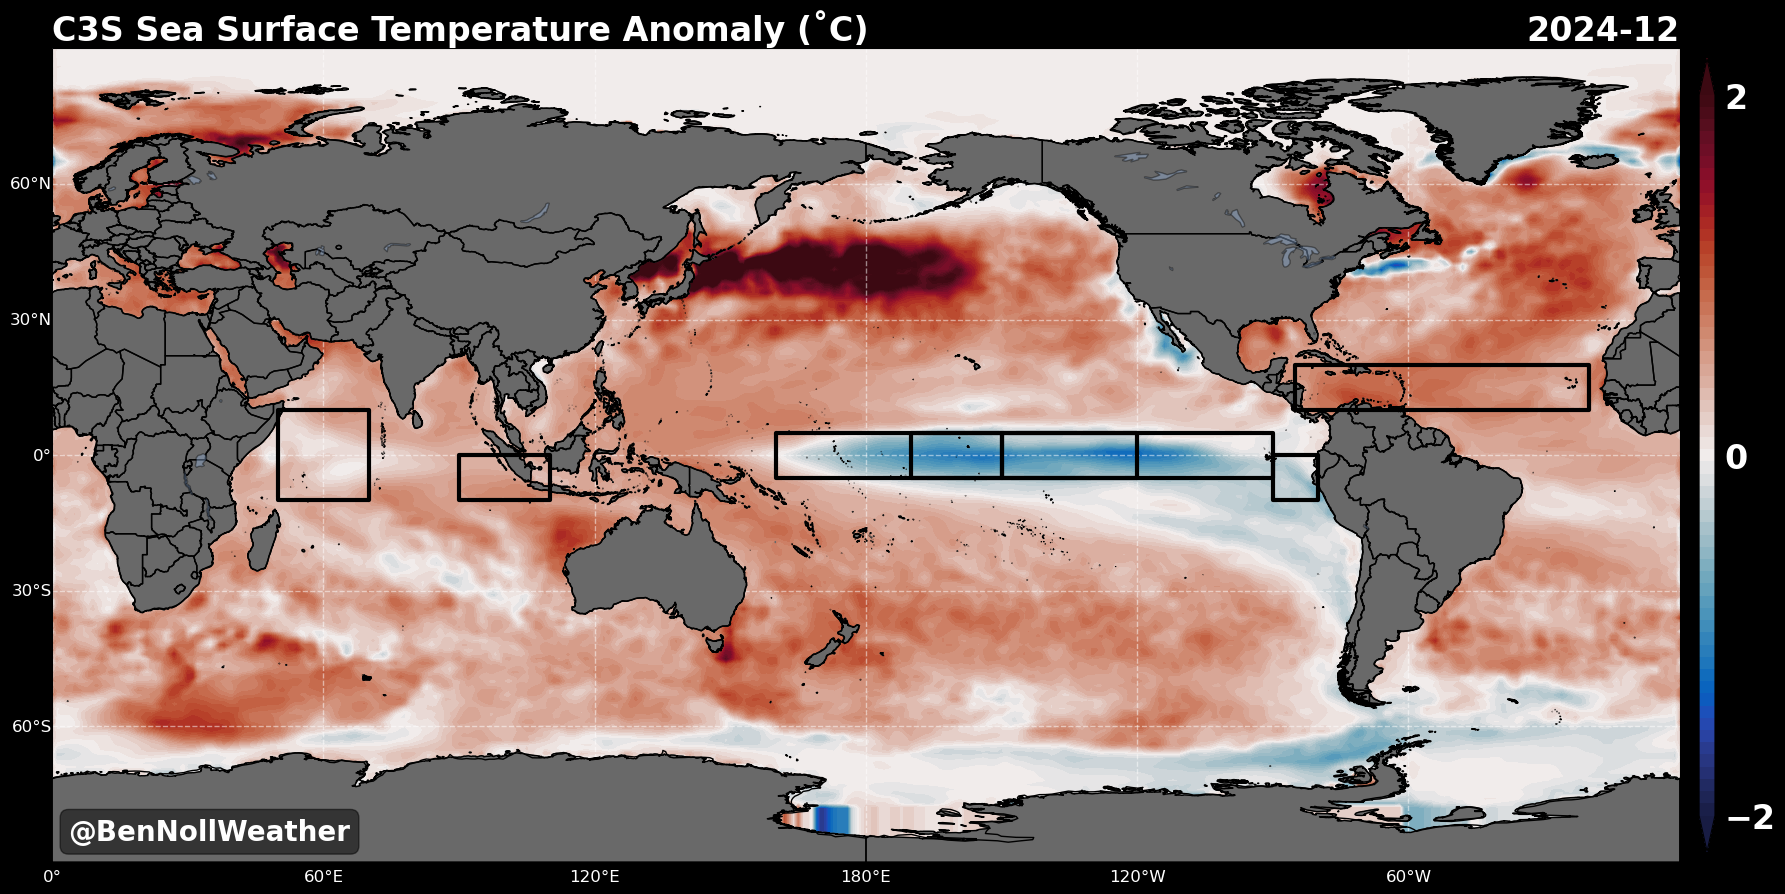
La Niña refers to a cooling of the seas in the eastern and central equatorial Pacific.
This causes reduced rainfall and thunderstorm activity in the equatorial Pacific Ocean and has flow-on effects to the climate in distant parts of the world, including the Hudson Valley. This meteorological concept is known as a teleconnection.
Jet streams
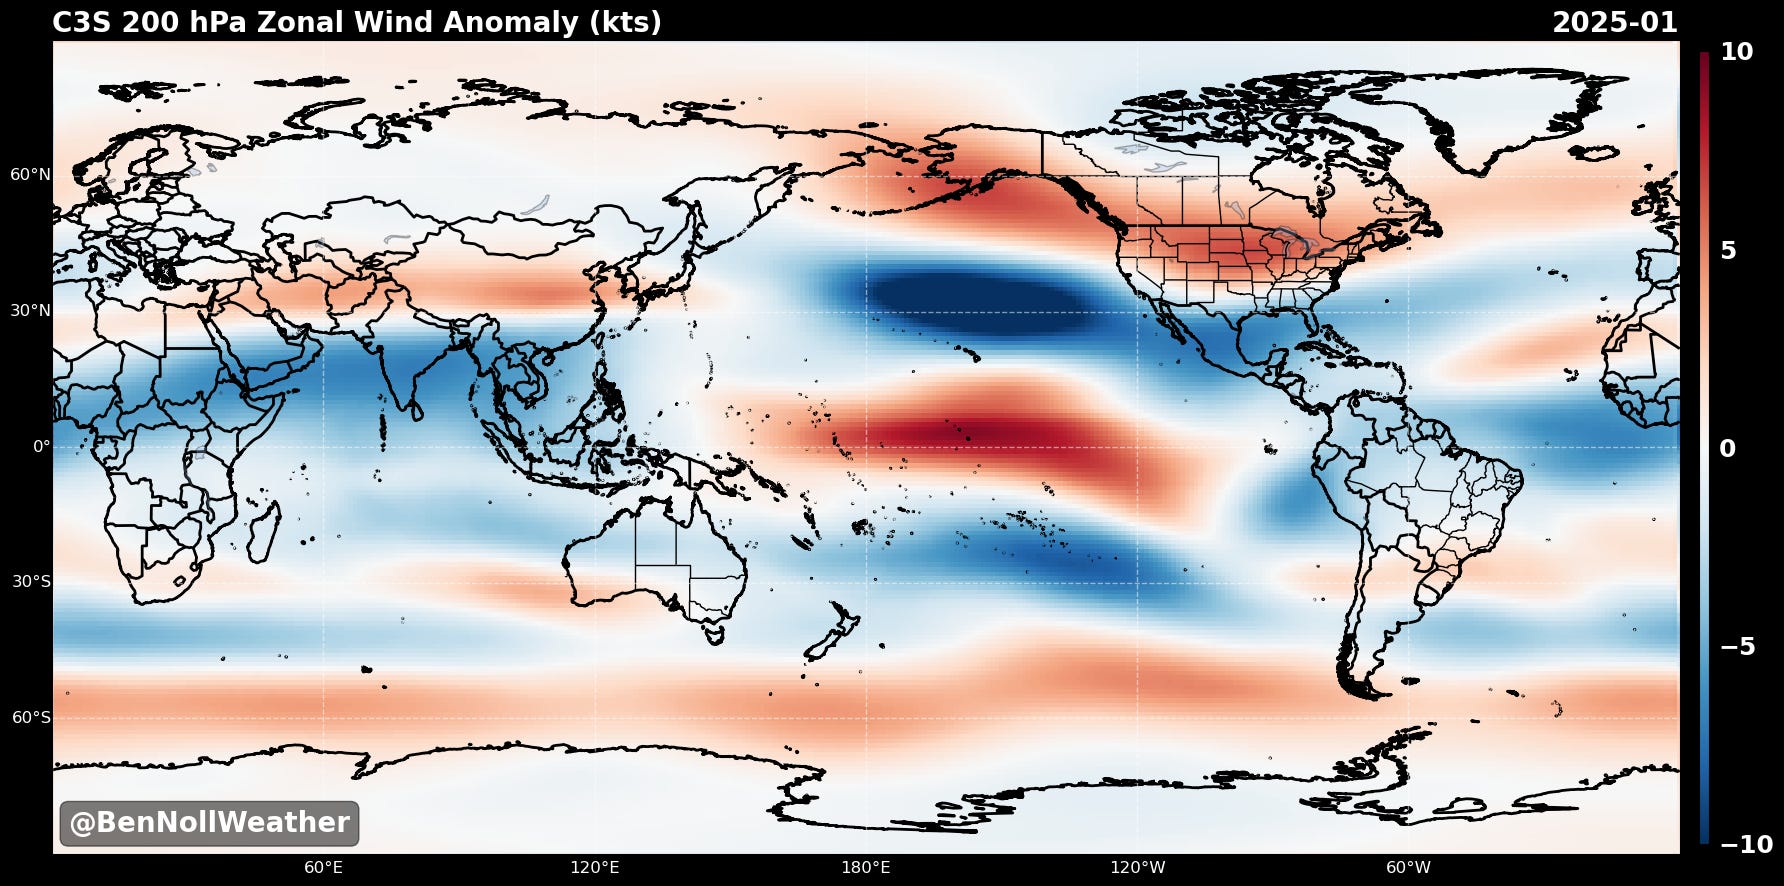
During La Niña, the cold water in the Pacific tends to influence a weaker sub-tropical jet stream. This weakened jet stream reduces the potential for significant storm systems to develop and track along the East Coast. This is because the sub-tropical jet stream plays a crucial role in transporting moisture and energy from the tropics into mid-latitudes, contributing to storm formation. With a less vigorous sub-tropical jet stream, the spark for coastal storms may be missing.
An abundance of warm water in the North Pacific Ocean and cooler seas in the Gulf of Alaska are forecast to be associated with a stronger than normal and northerly-displaced North Pacific jet stream. This may cause storms to slam into the Pacific Northwest and British Columbia. As air from the Pacific Ocean blows across the continental U.S., it can warm up, contributing to above average temperatures in the central and eastern states. When the jet stream weakens from time to time, it can loop toward Alaska and transport polar air masses from Canada into the northern tier of states, causing quick-moving systems called clippers that tend to quickly drop a few inches of snow before departing.
Warm Atlantic
Sometimes, all it takes is one good storm to make a memorable winter. A warmer than average western Atlantic Ocean is an ingredient that could help make that happen! Should a pocket of frigid, Canadian air find its way over top the warm seas, “atmospheric fireworks” may be set off, leading to the formation of a strong East Coast storm.
Pressure patterns
The long-range forecasting funnel starts wide. We want to answer the question: what does the broad circulation pattern look like? In other words, where is high and low pressure forecast to be?
The map below takes us to 500 hectopascals, some 20,000 feet above Earth’s surface. Things here are a little less chaotic than at the ground. That means the models tend to be a little more accurate.
Red colors indicate higher atmospheric heights, which generally imply more settled and milder weather. Blue shades indicate lower atmospheric heights and signal disturbed, colder conditions.
Opinions from 8 climate models are shown. All of them signal a ridge of high pressure (🔴) across the U.S., with 6 or 7 showing the high focused in the east. That’s not an ingredient in the recipe for a wall-to-wall harsh winter.
Precipitation
The good news is that if you didn’t like the soggy nature of last winter in the Hudson Valley, I think a repeat is unlikely. Model guidance is suggesting that the dry weather of fall could carry into at least the early portion of winter. The active Pacific jet would eventually take hold, shipping storms across the northern tier of states. However, it’s possible that these storms frequently cut to our west, drawing up warmer air from the south, making mixed precipitation or rain more likely than all snow.
Temperature
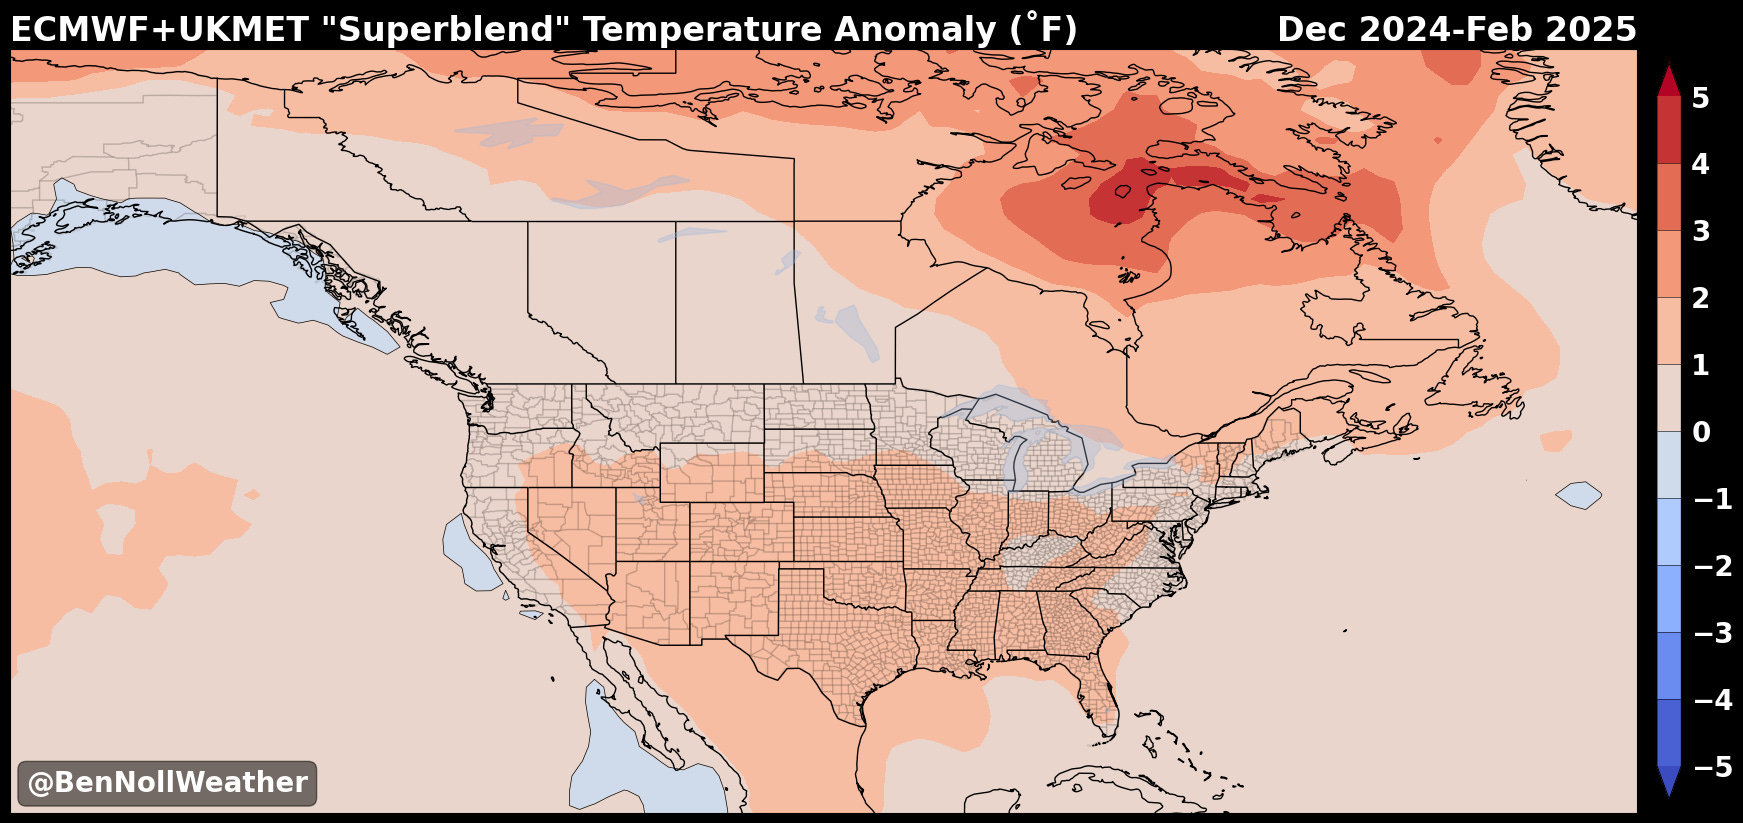
Simply put, the guidance is not keen on a colder than average winter. On the whole, it is slightly cooler than last winter. Last winter was 4˚F to 5˚F warmer than average. The tendency for a more active polar jet stream, especially later in winter, could come with short-but-sharp cold spells.
Snow — the bottom line ⤵️
It’s time to bring it all together. What does a warming climate, La Niña, jet streams, a warm North Pacific and Atlantic, and patterns of pressure, precipitation, and temperature mean for the number of snow days that you’ll have this year?
🔮 Magic 8 ball says: the odds aren’t in your favor. While I don’t think a snowier-than-normal winter is the most likely outcome, the lack of a strong El Niño is enough to keep hopes alive for a few well-timed snow days — especially if the polar vortex makes an appearance late in the season, like it did in the La Niña winter of 2021.
Climate models predict seasonal snowfall. Unlike air pressure, temperature, and precipitation, this isn’t a field that is routinely assessed by climate scientists.
However, I’ve been tracking its performance over the last few winters. It’s predicted lower than normal snowfall the last 5 winters and was accurate in 3 or 4 of the 5.
Here’s what it’s showing for the upcoming winter. If you live in Idaho, Montana, North Dakota, Minnesota, or Canada, you’ll want a good shovel. Elsewhere, the odds aren’t in your favor for a snowier than normal winter — including the Hudson Valley.
If numbers, probabilities, and odds are your thing, you’ll love the next chart. If not, cover your eyes.
It shows 51 different outcomes for snowfall for each month between October 2024 and March 2025 for Montgomery, Orange County. The blue colored rectangles represent scenarios with above normal monthly snowfall while red colored rectangles mean the opposite. Spoiler alert: there are many more red colored rectangles than blue ones!
To get something useful out of this data, I count the blue colored rectangles, divide by 51 (the total number of outcomes), and multiply by 100 to get the percentage chance of above normal snowfall for each month in the Hudson Valley.
Here’s the chance of above normal snowfall for each month:
November: 24%
December: 25%
January: 29%
February 37%
March 39%
Clearly, the odds aren’t great, but they ever-so-slightly favor a season that starts slow and finishes somewhat stronger.
A polar vortex disturbance, like the one that occurred in January 2021, could change the Hudson Valley’s fortunes and lead to heavy late winter snowfall.
Could things change?
Yes, of course! That’s what forecasting is all about — it’s about taking the latest information and trying to pull that forward using our knowledge of the ocean-atmosphere system. And sometimes, that information changes, and the forecast needs to be adjusted.
Unlike last year when we had a strong climate driver (El Niño), the drivers this year are a little less intense. This muddies the waters a bit and I think opens the door for surprises. I don’t think the door is wide open, but there is a little gap.
Of course, if the polar vortex appears poised to squeeze through that gap, I’ll be right by your side, guiding you through, and keeping the magic of snow days alive for as long as possible!
Happy almost snow day season! Thanks for reading and being a premium subscriber!


