
Hudson Valley summer: stunner or bummer? 🌞
Premium update #36

The unofficial start of summer, Memorial Day weekend, is a week away! With temperatures currently in the 60s, Mother Nature isn’t playing the part. While it will turn warmer in the week ahead, there will likely be another cooler change or two before summer-like temperatures become more firmly established.
Meteorological summer starts on Saturday, June 1st and it appears that our first 90 degree temperature of the year won’t be occurring until after that.
I’m here to answer the question on everyone’s mind: will this summer be a stunner or a bummer for the Hudson Valley? It can’t be any worse than last year — the summer of floods and wildfire smoke, right?


To help answer this, I’ll share a series of thematic maps. These color-coded works of meteorological art convey whether the months ahead might be warmer, cooler, wetter, drier, windier, calmer, sunnier, or cloudier than normal.
In order to do this, I download climate data from different international forecasting centers and use Python to parse it into aesthetically pleasing and easy-to-understand pictures.

Premium subscribers have the benefit of getting to explore this content, which you really can’t get anywhere else. This post is tailored to the Hudson Valley but would be insightful to anyone in the Northeast.

Without further ado, summer 2024 is looking like…
…it’s going to be a hot one 🥵
Temperatures
Predictions for summer temperatures across the U.S. are no slouch: temperatures of 2˚F to 4˚F above average are forecast to be commonplace, which is pretty significant when it coincides with the hottest time of the year. In the Hudson Valley, the weather pattern is shown to get hot starting in the second week of June 📈

Ocean trends
The ocean is the engine room of the atmosphere. That’s why monitoring sea temperatures —and particularly their difference from normal— is so important. This coming summer, there are two features that are particularly important to the climate in the United States: a very warm Atlantic Ocean and a transition out of El Niño and toward La Niña in the equatorial Pacific Ocean.
The warmth in the Atlantic Ocean is extreme: in parts of the basin, seas are as warm currently in May as they would typically be in August. This is expected to fuel a very active hurricane season.

➡️ The U.S. East Coast, including the Hudson Valley, will need to be on-guard for tropical impacts this coming summer and fall.
In the equatorial Pacific, the warm ocean water once associated with El Niño has cooled off. A rambunctious sub-tropical jet stream was fueled by these warm seas over the last 6-9 months and was one of the main driving forces behind excessive rainfall in the Hudson Valley.
Now, the pattern is flipping and the jet stream will become less of a factor…
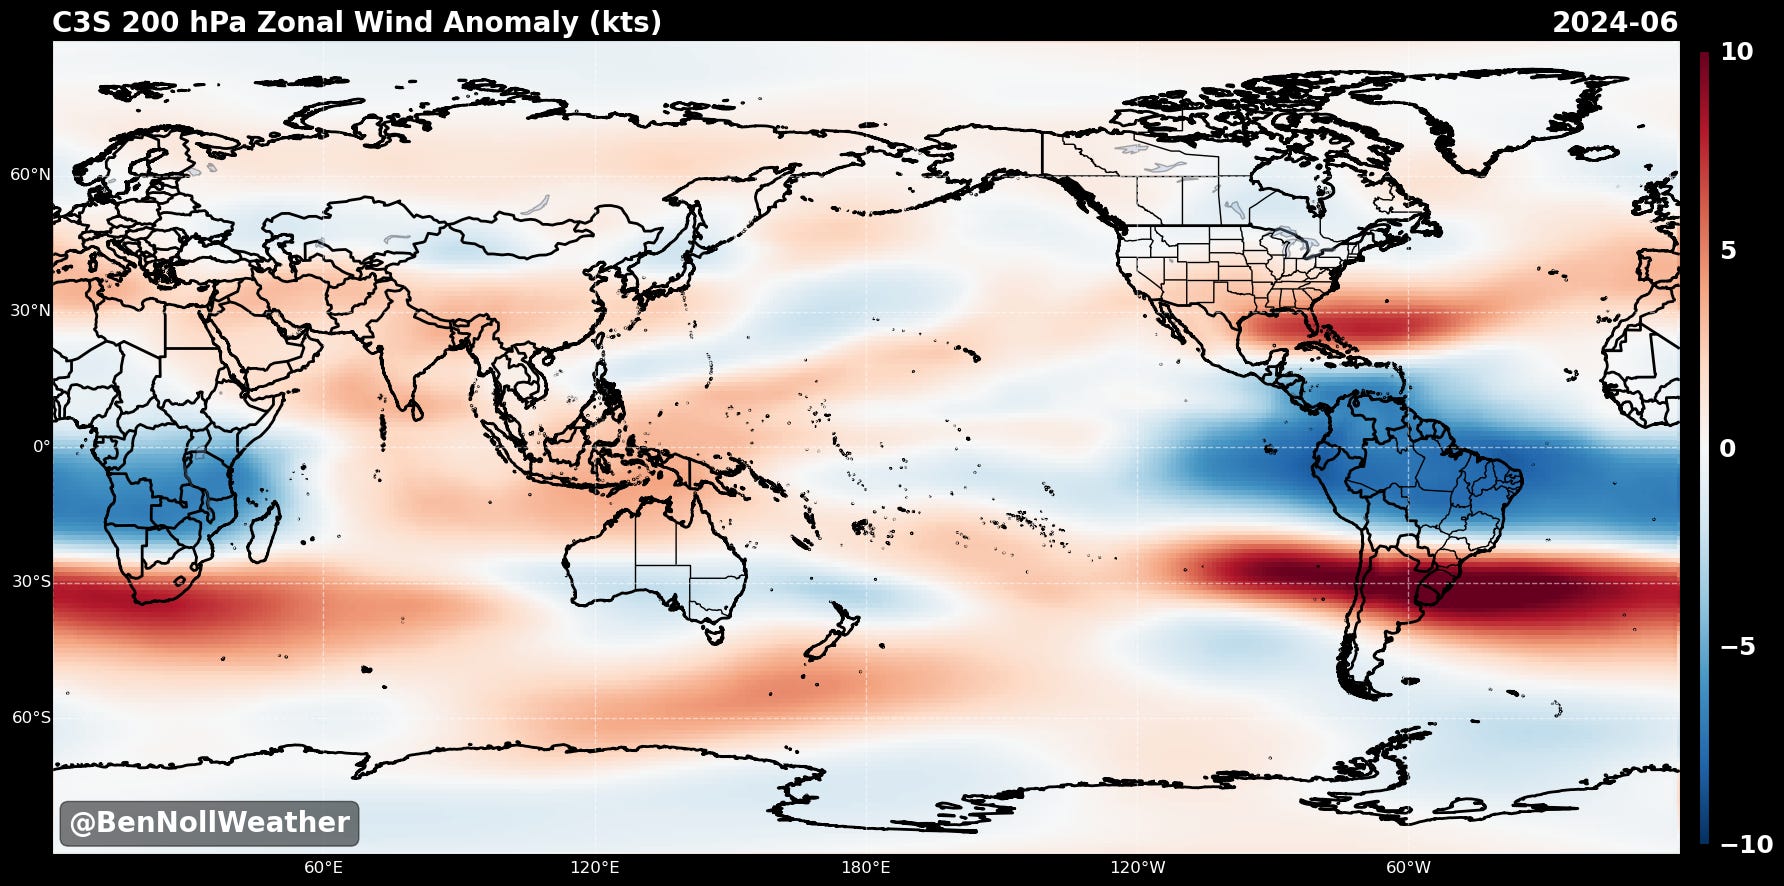
Jet stream patterns
Compare the two maps below: the first shows the forecast jet stream pattern during June and the second during July. The map for June has red coloring across the southern U.S., which suggests the sub-tropical jet stream may still send a few storms our way. The July map shows an increase in blue coloring across the U.S., suggesting an easing of the jet stream. This change may be associated with decreasing rainfall chances for the Hudson Valley between June and July.

Rainfall
There’s no denying it: distilling all of these drivers into a rainfall outlook for summer is challenging.
On the balance of the different factors described above, it seems unlikely that there will be significant rainfall deficits in the Hudson Valley this summer.
The image below shows the precipitation anomaly (difference from normal) from two leading climate models during June-August. Strands of green (above normal rainfall) around the eastern seaboard suggest that there will be storms at a semi-regular interval.

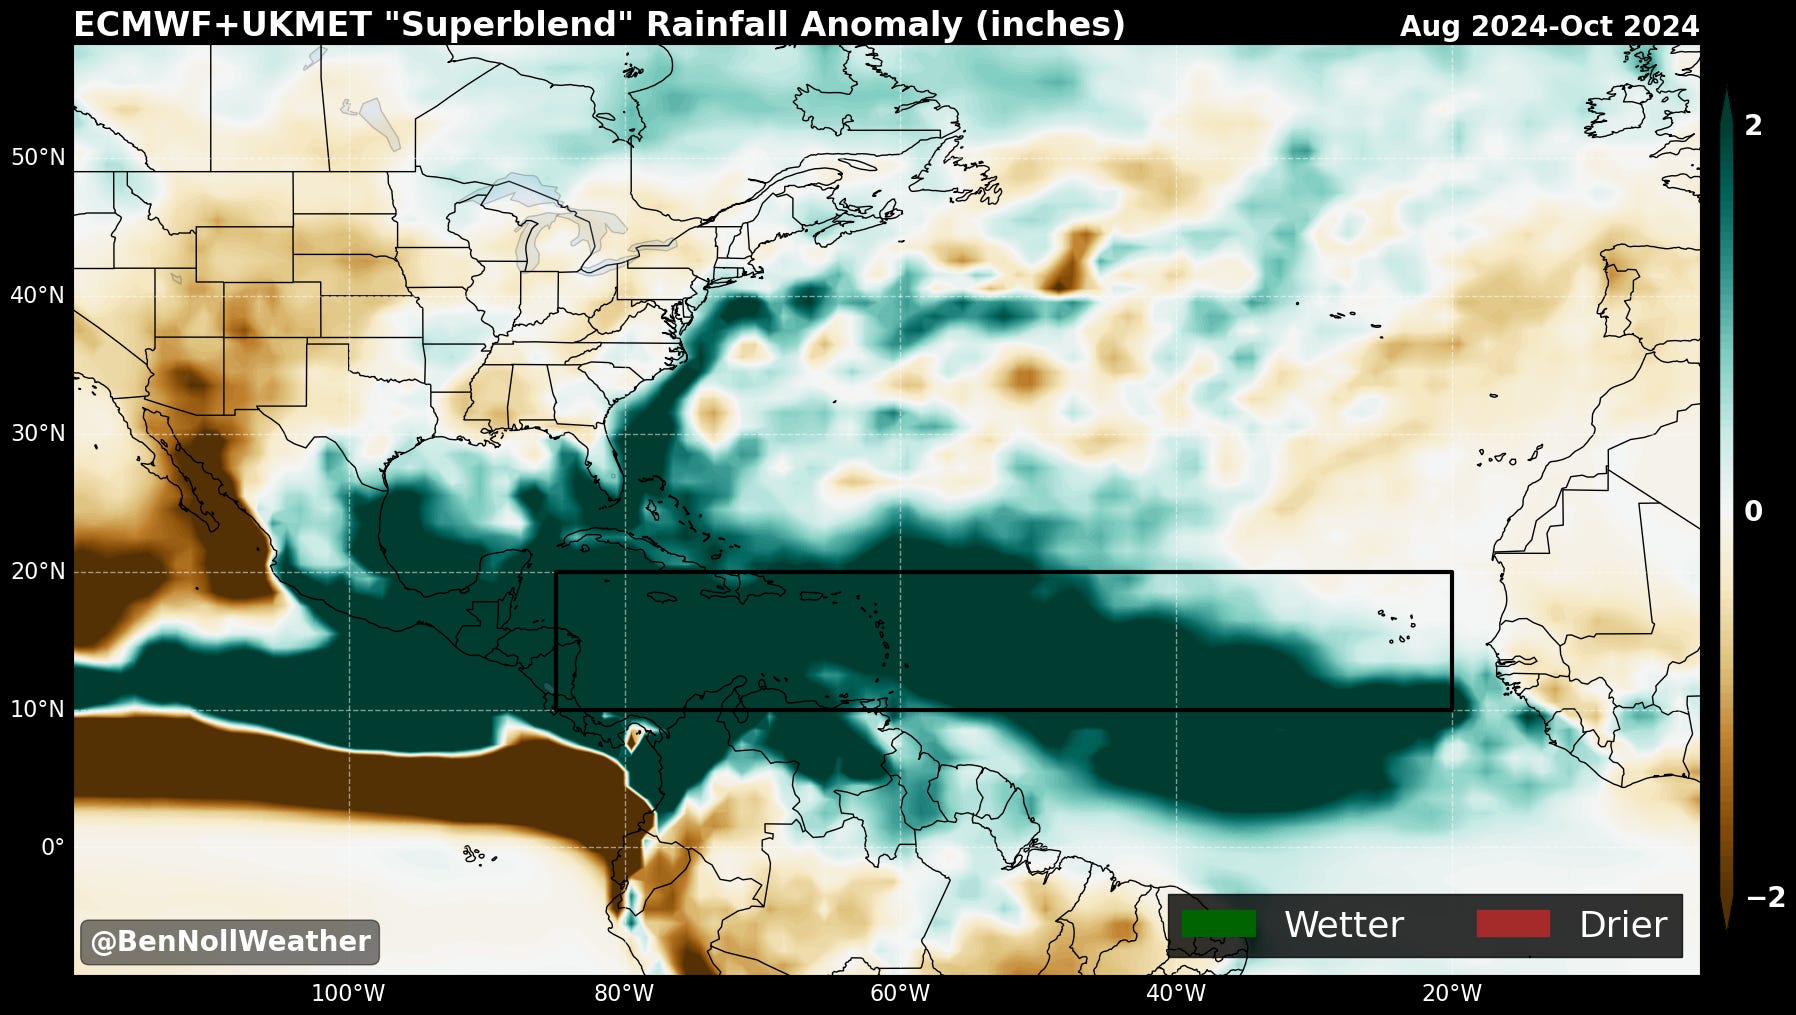
The map below shows the rainfall pattern during August-October. Large and widespread green colors indicate a very active Atlantic hurricane season, although browns (below normal rainfall) are forecast to become more widespread in the eastern U.S. — this may be indicative of more dry spells later in the summer season and during fall.
The main wildcard will be tropical storm and hurricane activity. If such a system were to directly affect the region, impacts would be substantial. Being “ready” is important every year, but elevated preparedness is encouraged this year.
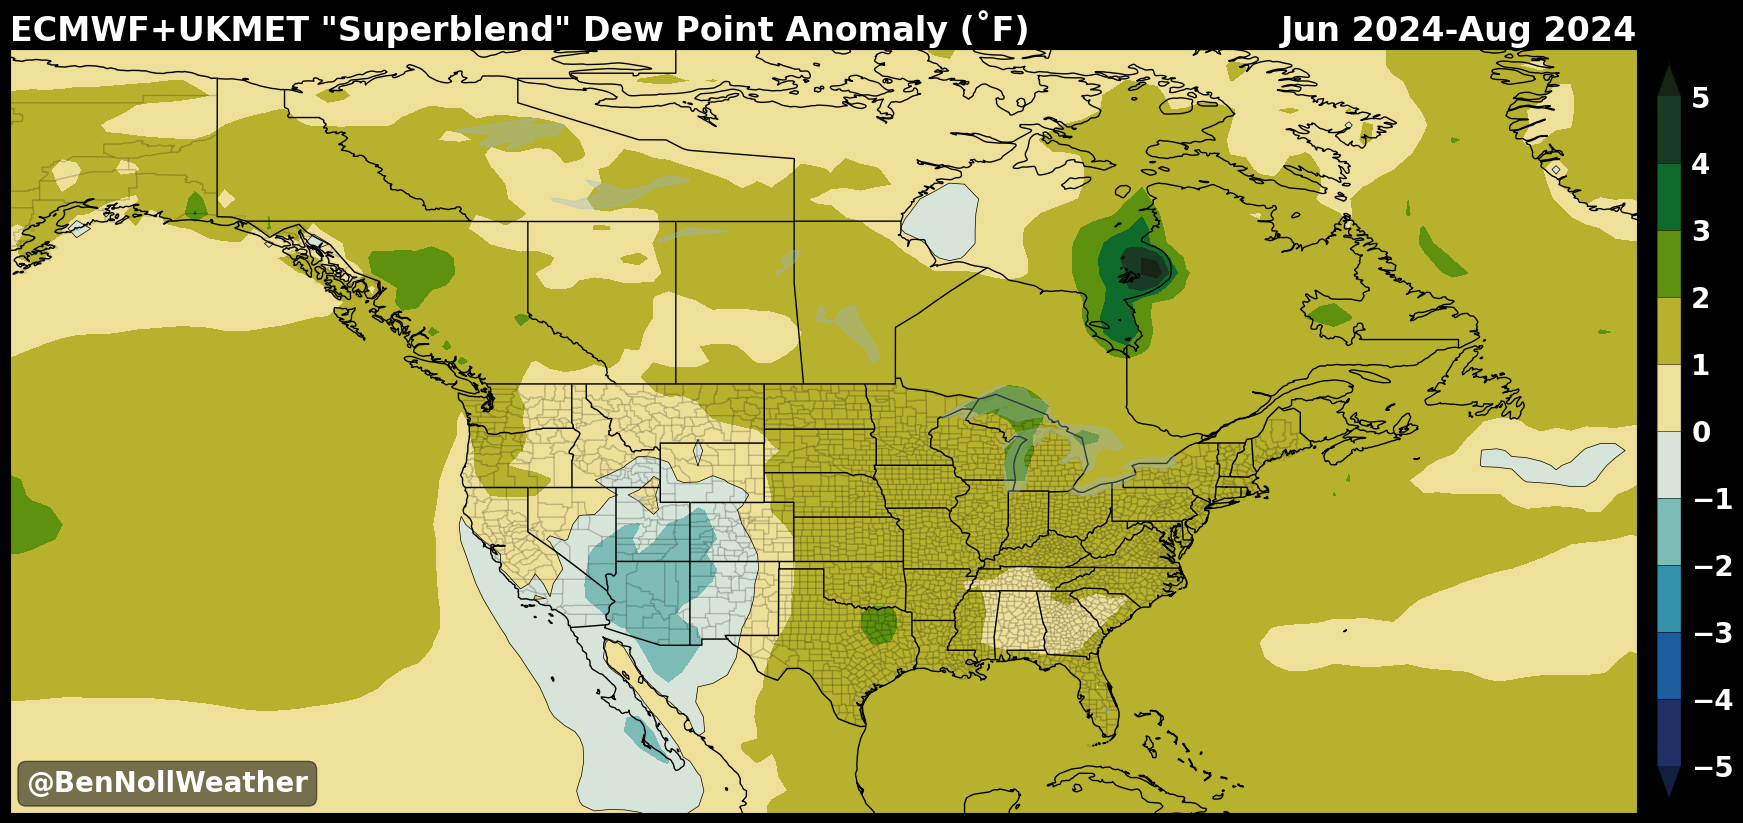
Humidity
The long-term trend is toward a more humid atmosphere, as I shared in my post about climate change in the Hudson Valley. 2023 was the 3rd-most humid year on record for the region.

Summer 2024 looks primed and ready to contribute to that trend. In the map below, green areas indicate above normal summer humidity and blue areas below normal.
There isn’t much blue 🥵
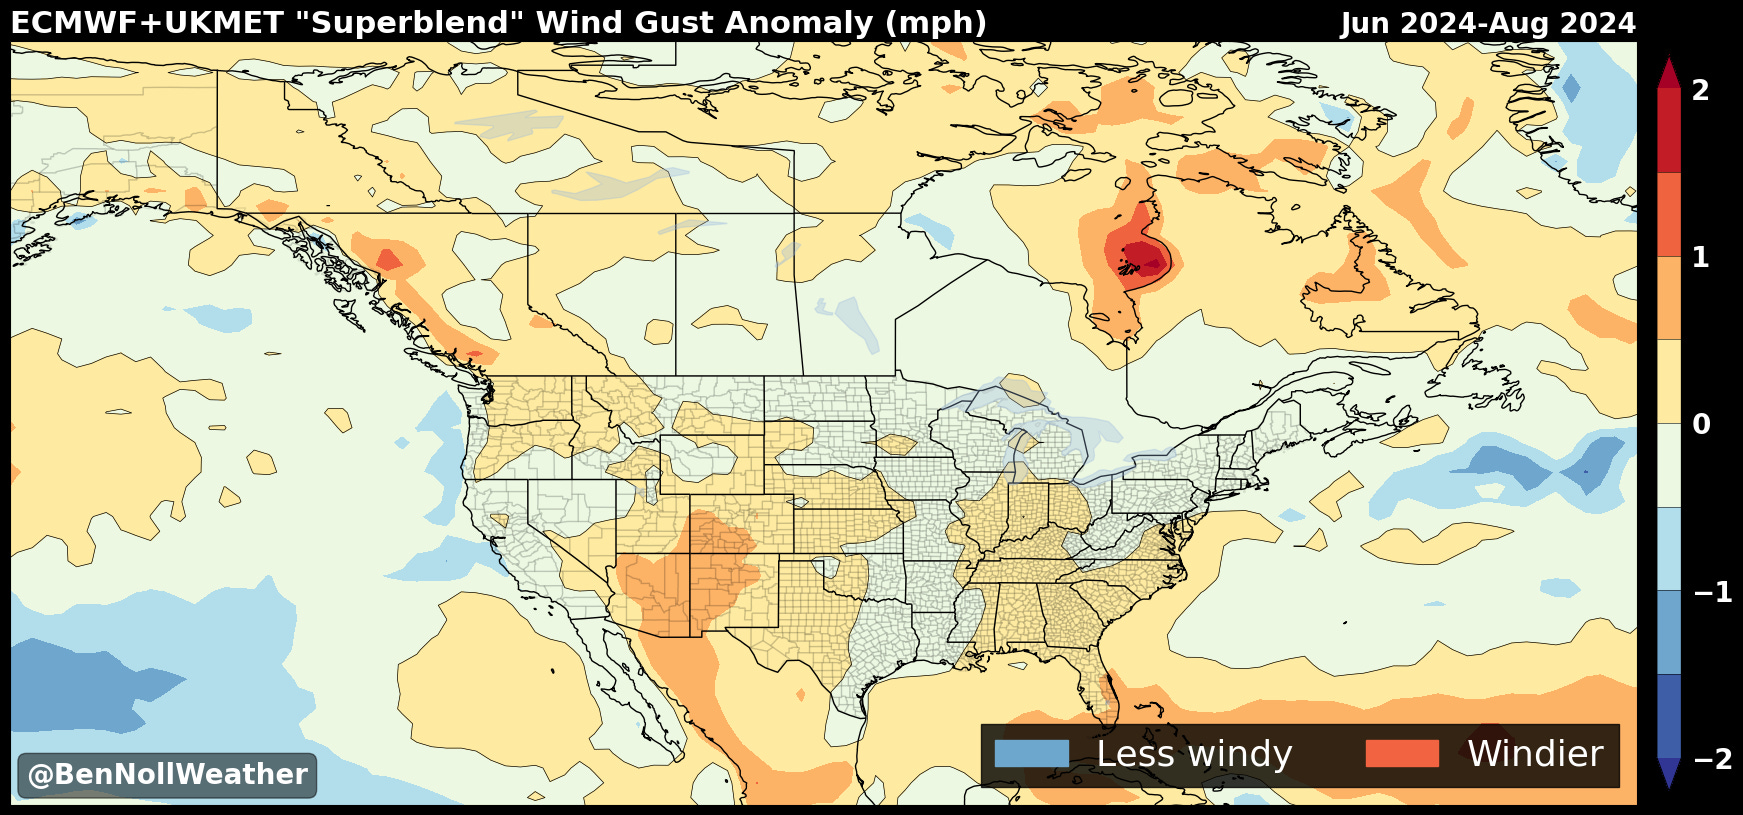
Wind
Will there at least be some wind to temper the heat and humidity? Certainly if a tropical storm approached, there would be! But for the summer as whole, the climate models suggest near normal winds for our region.
Note the orange coloring over the southeastern states and Florida. This is likely linked to the above normal risk for tropical storms and hurricanes.
Wildfire smoke
Wildfires are already actively burning in Canada. More fires are burning in Mexico. This has contributed to plumes of smoke affecting the U.S. from both the north and south and it’s only May.
The summer rainfall outlook suggests that eastern Canada, the source region of last year’s suffocating smoke, is more likely to experience wetter than normal conditions. Western Canada is favored to have drier than normal conditions. Based on this, it seems like a repeat of last year’s intensely smoky skies is a long shot, but I don’t think we’ll escape the summer smoke-free.
The map below shows the current global smoke plumes and their forecast trajectory over the next five days. You can access daily updates of these maps here.

Sunshine 🌞
Enough about rain and smoke, let’s end on a bright note, shall we? This map shows predicted summer cloud cover as a percentage difference from normal. The orange areas indicate less cloud cover than normal and purples show more cloud cover than normal.
There’s a lot of orange! ☀️
As a word of caution, I haven’t historically assessed cloud cover outlooks, so I would take this information with a grain of salt… but at least it’s not showing a cloudier-than-normal summer at this point! 🕶️

Key messages
So will summer be a stunner or a bummer in the Hudson Valley? You might have a different answer depending on the month!
A trend toward high heat and humidity starting in the second week of June; a warmer and more humid than average summer looks likely overall
Unlikely to be sharply drier than normal; sub-tropical jet stream looks to still contribute some moisture during June
Above average chance for an impact from a tropical storm or hurricane 🌀
Sunnier times ahead: with the relaxation of the jet stream in July and August, the percentage of sunny days may rise
Unlikely to be as smoky as last summer 💨
Thanks so much for being a premium subscriber. I hope you enjoyed the article. May the forecast be in your favor ✌️
Thank you very much! Great job! Ugh, I hate humidity!
great job. I too love the weather and love to read and watch events