Hudson Valley 2020-21 winter outlook ☃️
Greetings, Hudson Valley.
Where has 2020 gone?! As of this writing, Halloween is in 2 weeks, Thanksgiving in 6, and Christmas in 10.
Last year, the first snow fell at the start of December. The year before that, it was mid-November.
Using recent history as a guide, our first snow event should be 5 to 8 weeks away.
That means it’s time for one of my favorite write-ups of the year: the Hudson Valley winter outlook!
In New Zealand, this is what I do for a living: assess long range weather and climate patterns to help people plan for impactful events like drought, hurricanes, and heatwaves. I’m in my element with this post.
So sit back, grab a cup of your favorite beverage, and get ready to learn about the ins and outs of a long range outlook and what the Hudson Valley might expect to see this coming winter!
Heads up! This post is pretty long. If you’re just after the key messages, here you go…
Each year I grapple with whether to do something short or long. This year, I went with the latter so that folks could appreciate the process.
Not expecting the coldest of winters
Short but sharp cold snaps will be followed up by mild air
Probably more snow than last year (not hard to do, I know!)
January looks like the snowiest month
I wouldn't be shocked if the vibe was a not-so-bad winter overall
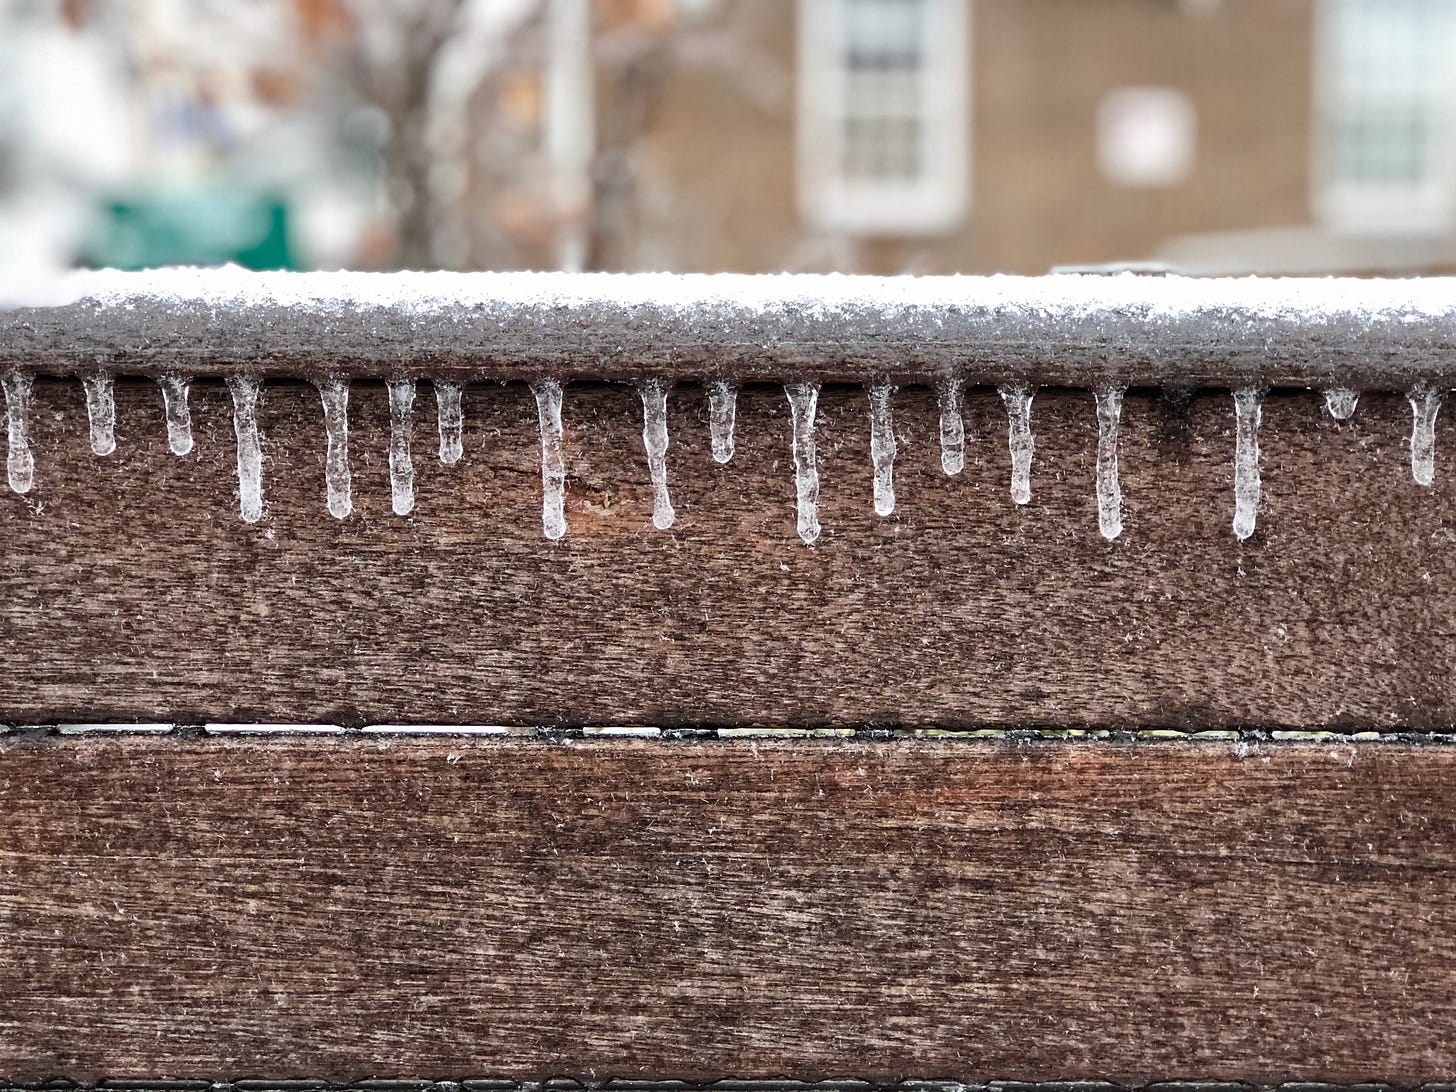
Liberty, NY | January 2020
How it’s done
It isn’t crystal ball gazing or witchcraft. While an outlook months into the future may seem better suited for a soothsayer, it’s based firmly upon science and data.
It starts with identifying the climate drivers. You first have to understand who is at the wheel of Mother Nature’s car before you can predict where it will go.
You’ve probably heard of climate phenomena like “El Niño” or “La Niña” but unless you’re a science teacher or a weather enthusiast you probably don’t know what they mean.
El Niño and La Niña make up the “El Niño Southern Oscillation” or ENSO for short. ENSO is a natural cycle of sea surface temperatures in the equatorial Pacific Ocean. El Niño is the warm phase of the phenomenon, during which ocean temperatures from South America to the central Pacific Ocean become warmer than average. In the opposite phase, La Niña, cooler than average ocean temperatures encompass the same region. The changes in ocean temperatures arise from variations in the trade winds that blow in the tropical latitudes.
For winter 2020, we will experience La Niña conditions.
La Niña conditions are indicated by the tongue of colder than average water (blue color) in the central equatorial Pacific Ocean. SST stands for “sea surface temperature”.
I presented an educational video on ENSO at my job in New Zealand.
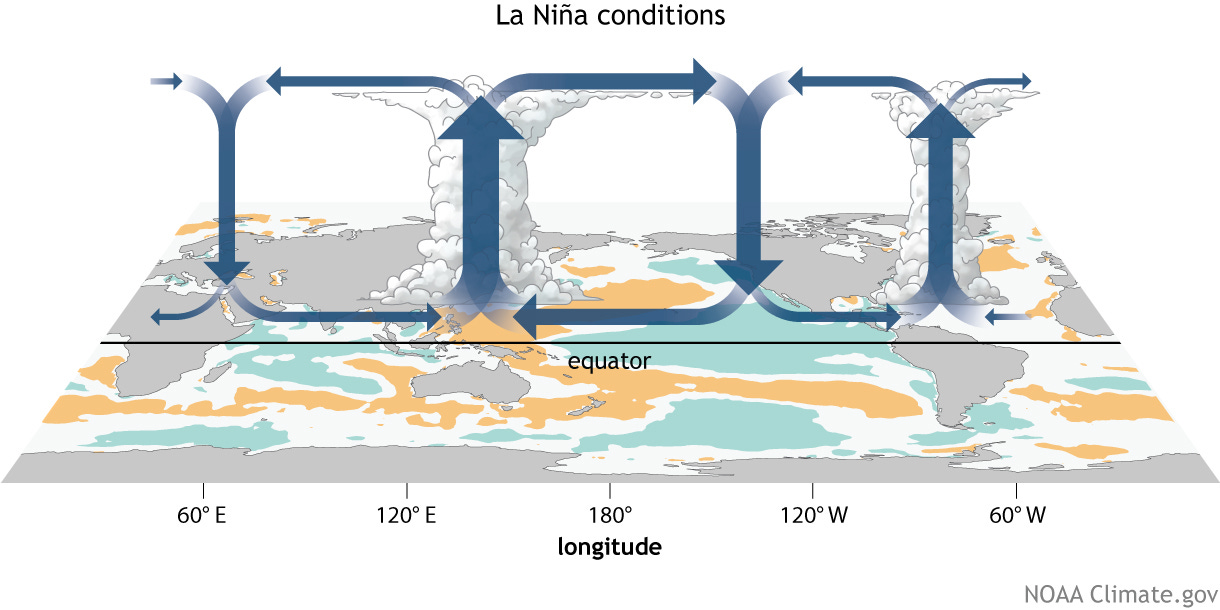
Why does ENSO matter to the Hudson Valley? Anomalies in the tropical Pacific Ocean have an impact on the atmosphere. Warmer tropical seas are a focal point for rising air, causing rain, thunderstorms, and clouds. Where the seas are cooler, subsidence (sinking air) is more likely, bringing sunny and rain-free conditions. The patterns of stormy and calm weather across the global tropics represent the Walker Circulation.
The diagram below shows the typical Walker Circulation setup during La Niña. Stormy weather tends to occur over a warm pool of ocean water in the western Pacific Ocean.
Green (orange) = cooler (warmer) than average sea temperatures
Anomalies, or deviations from the norm, in the Walker Circulation have flow on effects to air pressure patterns not just in the tropics but across the mid-latitudes, including the United States.
The effect of La Niña and El Niño is distinctively different. During El Niño, rising air occurs further east, closer to Mexico and South America.
While we know the average (historical) outcome of El Niño or La Niña as it pertains to the weather in the Hudson Valley, no El Niño or La Niña is average. That is to say, each ENSO event is unique and takes on a slightly different flavor. Also, we can only attribute up to about 25% of our climate variability to ENSO during winter.
The ENSO phase is a good starting place for a climate outlook, but it is far from the finish line.
Seasonal climate predictability can also be gleaned from air pressure patterns in the North Atlantic Ocean, polar patterns relating to sea ice, stratospheric winds above the equator, ocean temperature anomalies along the U.S. coastlines, ocean temperature anomalies in the Indian Ocean, the solar cycle, and a tropical weather cycle called the Madden-Julian Oscillation.
I won’t go through all of these, but it showcases the multidemensionality and complexity of long-range prediction.
Before going into the next section, it is worth mentioning that to a meteorologist or climatologist, winter is the months of December through February.
Meteorological seasons are based on the annual temperature cycle with the seasons classified by three month periods with the most similar temperatures.
Meteorological winter: December-February
Meteorological spring: March-May
Meteorological summer: June-August
Meteorological fall: September-November
You can read more about the difference between meteorological and astronomical seasons in my post here.
Next, we identify analogs
In order to look toward the future, we must first look into the past. That doesn’t sound counterintuitive, does it? 🙃
Past years that have similar climate characteristics to the present are called analogs.
Analog years are determined by looking into (and matching) the ENSO phase as well as the other climate drivers that are expected to play an important role in the upcoming season.
Since finding an exact match is not a typical occurrence, one technique is to create a composite, or blend, of several analog years.
If several analog years have a similar climatic flavor, it would be apparent in the analog composite (average). By blending the years together, it can be determined if a season is more likely to be mild, cold, rainy, snowy, or dry.
The analog forecast method will feature in my Hudson Valley outlook this year.
We also assess climate models
There are about a dozen well-known (in the weather world) seasonal climate models. These sophisticated simulations run on supercomputers at global producing centers like NOAA, Environment Canada, the Australia Bureau of Meteorology, the European Centre for Medium Range Weather Forecasts, the UK Met Office, and more. Based on the current status of the ocean-atmosphere system, these models predict general circulation patterns (large scale air flow) out 6 to 12 months.
They can provide particularly useful predictions out to about three months (i.e. a general idea of prevailing weather patterns) but skill declines thereafter as the influence of the initial conditions that are fed into the model wane.
The climate models are improving as advances in supercomputing have afforded dramatic increases in model resolution.
I post these types of models on my Twitter feed from time to time, with colorful depictions of pressure, temperature, rain, and snow.
Montgomery, NY | December 2019
What a long range outlook is and isn’t
This isn't a weather forecast, it's a climate outlook. Weather forecasts can provide precise details about what conditions to expect over the next few days. You can think of the weather like the clothes you choose to wear in a given week. During a colder than average winter week, you’ll probably be wearing a hat, gloves, scarf, and a heavy jacket. In a milder week, you could forget the accessories and opt for a sweatshirt instead.
On the other hand, climate outlooks can provide the most likely weather themes (i.e. wetter/drier/milder/colder) in the coming weeks to months. You can think of the climate like the contents of your wardrobe. During a winter season, you’ll inevitably need a hat, gloves, a scarf, a heavy jacket, and a sweatshirt, but will you wear the sweatshirt more than the heavy jacket? That will depend on the climate as a whole over the winter season.
Said differently: meteorologists make predictions, but are not prophets. We can’t tell you what the weather will be like on your wedding day six months months from now, exactly what it will be like on Christmas Day, or if it will rain exactly at 4:00 pm on Friday. If we could, we’d be driving much nicer cars!
The outlook
And after all that, it is time to get to the meat and potatoes of this post.
One way of communicating the most likely state of the climate for the winter season is something I call a quadrant climate chart.
By leveraging NOAA’s historical weather data, I sort the winter seasons since 1949 by temperature and precipitation (rain and snow). Based on the numbers, each year falls into a bin: mild and dry (upper left), mild and wet (upper right), cold and dry (bottom left), and cold and snowy (bottom right).
I’ve circled the part of the chart that includes last winter’s data point: it was mild and slightly on the drier side.
Enter: the analogs. For winter 2020-21, we have La Niña conditions. That means we can look for La Niña events in the recent past as a starting point for identifying analogs.
The second circle is the average of the analog years, which, compared to last year, is not as warm and a little less dry — pretty close to average, actually.
But that doesn’t tell the whole story. A majority of the analog years (5 out of 8) had below average winter temperatures. On the other hand, 3 of the 8 years (less than half) had above normal precipitation.
The most recent analog year (2017-18) had winter temperatures that were slightly below average along with slightly less precipitation than normal.
What we can conclude: the analog years, as a collective, favor a winter than isn’t as warm as last year but has a little more precipitation.
Snow patterns ☃️
We can look back at the snow that fell during the analog years for an indication as to what might occur this year. The most recent La Niña event was in late 2017 and early 2018, which featured a very snowy March after a fairly average December-February.
November-March snowfall during the analog years ranged from 21 to 70 inches with an average of 47 inches. As a point of reference, the long-term annual average for the Hudson Valley is about 40 inches. Based on this forecast method, the winter season could feature near or even slightly above normal snowfall in the Hudson Valley! ❄️
Snowfall (inches) during the analog years
During the analog years, Novembers tended to be quiet (0 to 2 inches) while December featured quite a range in snowfall, from as little as 1 inch (bust) to as many as 19 (boom). January was the most consistently snowy month, with 7 inches in the least-snowy year. February had the largest spread in snowfall (4 to 38 inches) with an average of 13 inches and March averaged a non-negligible 9 inches.
For early winter, the best analogs are 2017-18, 2013-14, 2011-12, 2008-09, and 2007-08 which yield an inch in November, 13 in December, and 11 in January. For late winter, 2007-08 and 1999-00 are preferred, which gives 11 inches in February and 4 in March. The winter snowfall total based on the preferred analogs is 39 inches — bang on average.
The 2011-12 snow season comes with an asterisk. That year had the 2011 Halloween nor’easter, producing around 9 inches in the Hudson Valley.
Do you remember? It caused some pretty wild scenes!
Speaking of October, the nation’s midsection is about to plunge straight into winter with cold and snow coming for places like the Rockies, Plains, and Upper Midwest through the end of the month. After some more warmth, The Hudson Valley is likely to get at least a taste of this before Halloween 👀
Temperatures as a difference from normal, 17-27 October
One additional year is an “honorable mention” — 1988-89. This was a low snowfall winter for the Hudson Valley with just 23 inches.
The snowiest March was the most recent one on the list: 2018. Who can forget the snow storm of March 7th, 2018? The Hudson Valley received 10 to 20 inches with a localized maximum of more than 2 feet in Monroe, Orange County!
📸 Maddy Fulton | Monroe, NY | March 7th, 2018
My take? 7 out of 8 analog years had at least 33 inches of snow from November-March. That’s more than last winter. If we take away the least snowy (2011-12) and most snowy (2013-14) seasons, we’re left with an average of 46 inches or about 6 inches above normal. However, let’s keep in mind that none of the winters broke records for total winter snowfall!
Speaking of last winter, do you remember what happened? Snow was only about half of the long-term normal (around 20 inches), depending on your location. Temperatures were unseasonably mild.
Now: the models. One way I like illustrating possible year-to-year differences is by taking the model guidance ahead of last winter and subtracting it from the model guidance from the same time this year. This can be done for both temperature and precipitation. Since many folks are able to recall last winter, it can be a useful comparison.
This first map shows predicted winter 2019-20 temperatures from October 2019 minus predicted winter 2020-21 temperatures from October 2020. The utility of this analysis depends on model accuracy — fortunately, it was, except for Alaska, where it was too warm, which means we should take caution in the strong indication that the upcoming winter will be colder than last winter there.
For the much of the U.S., except the Upper Midwest, Plains, and Northwest, this map can be interpreted as “the upcoming winter should be about as mild as last.”
It suggests that colder temperatures, compared to last winter, will be found in places like the Dakotas, Minnesota, Montana, Washington, and Oregon.
The blue shades appearing well to our west likely indicate a stronger-than-normal polar jet stream, which can transport colder air from Alaska and Canada across the northern tier of states. This colder air can sweep into the Northeast from time to time, but can quickly be replaced by warmer air from the southwest.
It isn’t the deciding factor in my outlook, but it is an interesting piece to consider. Take home message? It doesn’t support a significantly colder than average winter across the wider Northeast and Hudson Valley, but this doesn’t mean that it can’t snow!
The same comparison can be done for precipitation.

Here, we see that more precipitation than last winter is predicted over the Northwest, Midwest, Great Lakes, and interior Northeast. At the same time, less precipitation is forecast across California, the Southeast, and Florida, which indicates a persistent ridge of high pressure in that part of the country.
Based on the color shading in our corner of the country, it looks like the Northeast would be a bit less susceptible to coastal snow storms and more likely to experience storms from the west. Storms that track in from or to the west of the Hudson Valley tend to drag up warmer air from the south before they arrive or come with milder air from the Pacific Ocean. They can also bring short but sharp rounds of cold Canadian air with light, fluffy snow from systems called “Alberta clippers”.
Last winter had slightly less precipitation than normal in the Hudson Valley, so if this one turned out to have a bit more, it would be a change year-on-year.
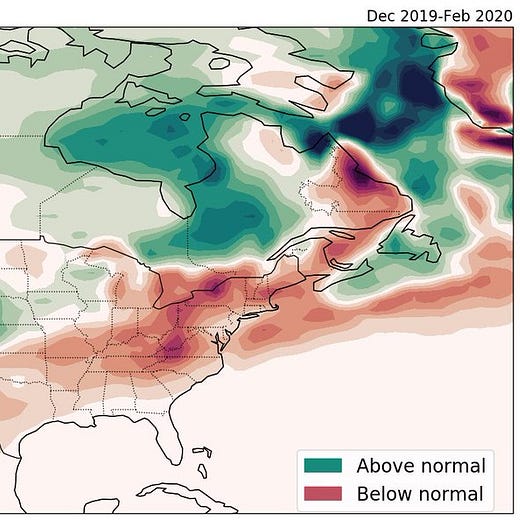
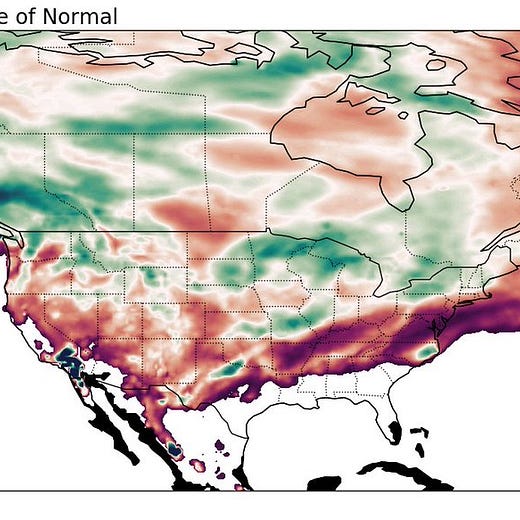
In 2020, our climate models even predict seasonal snowfall. The accuracy of this particular field, called “snowfall anomaly”, is dependent on the accuracy of the pressure patterns that the model is predicting. It can be useful in identifying broad themes: does the model expect more or less snow in a certain part of the country?
For this year, a blend of our two best seasonal models isn’t keen on above normal snowfall in the Northeast. The models certainly aren’t bashful in that prediction either with multiple tiers of below normal shown.
On the other hand, the Northwest, Rockies, and Canada are looking like: 🏔️

How did this product do last year? Quite well, actually! The top image shows the prediction for winter 2019-2020 from October and the bottom image shows what happened 👇
The model guidance is less optimistic than the analogs when it comes to our snowfall chances this winter.
An equally weighted blend of the analogs and models would produce slightly less snow than normal this winter.
Final thoughts
If you made it this far, congratulations! I hope you feel a little more informed about the process a forecaster goes through to make a long-range prediction and that you have something to talk about at the dinner table tonight.
If we don’t have weather forecasting in spades, we are darn close. For that reason, I like to say “climate is the new weather”. In other words, as we maximize predictability on the weather time scale (inside of a week), the focus of meteorologists, climatologists, and data scientists is shifting to longer time horizons, on the scale of weeks to months. Centuries ago, long-range prediction was the relative guesswork of climate soothsayers. Now, its advancement sits on the leading edge of climate science. Rich datasets are seeing their potential realized by things like machine learning applications and artificial intelligence to push the boundaries of modern predictability. I’m quite proud to have a small role in such a project right now.
Many sectors contract services for long range outlooks to help with planning, decision making, and strategy. This could involve a department store having a larger or smaller stock of snowblowers based on climate expectations. It could also involve the strategic placement of goods, like rock salt, in regions that are expecting a rougher winter season. It could also be a farmer preparing him or herself for a drought.
It’s fair to say that organizations pay a pretty penny for such predictions in 2020 with the increasing hit rates of long-range guidance and our ever-growing understanding of the climate system.
It doesn’t mean that we’ll nail the outlook every season, but an understanding of climate tendencies, in broad strokes, months in advance is within the realm of our predictive powers. I dream of where we’ll be by 2040 and take pride in playing a small role in advancing the science.
As for predicting Hudson Valley snow days, I’ll still be with you every step of the way this year, but the meaning of a snow day is, well, different in 2020…
I hope you had fun reading the winter “tea leaves” with me. If you found this post useful, please consider a small donation. I don’t charge for my forecasts and don’t intend to, but small contributions help cover computer programming, forecasting, and writing time. Thank you 🙏
Donations: https://www.paypal.com/cgi-bin/webscr?cmd=_s-xclick&hosted_button_id=UZBXYEUA89SPC&source=url
Merch: https://teespring.com/stores/bennollweather





Wow - Ben, you put the winter forecast into laymens' terms that even I can almost understand.
I live in Walden NY and really appreciate your keeping up with our weather patterns from your side of the world.
Tim from way out here in NY