
Winter takes a brief break ⏳
Premium update #18

🎉 Happy almost new year! With 2022 nearly in the rear-view, it’s time to take a look through the windshield to see what early 2023 may bring to the Hudson Valley.
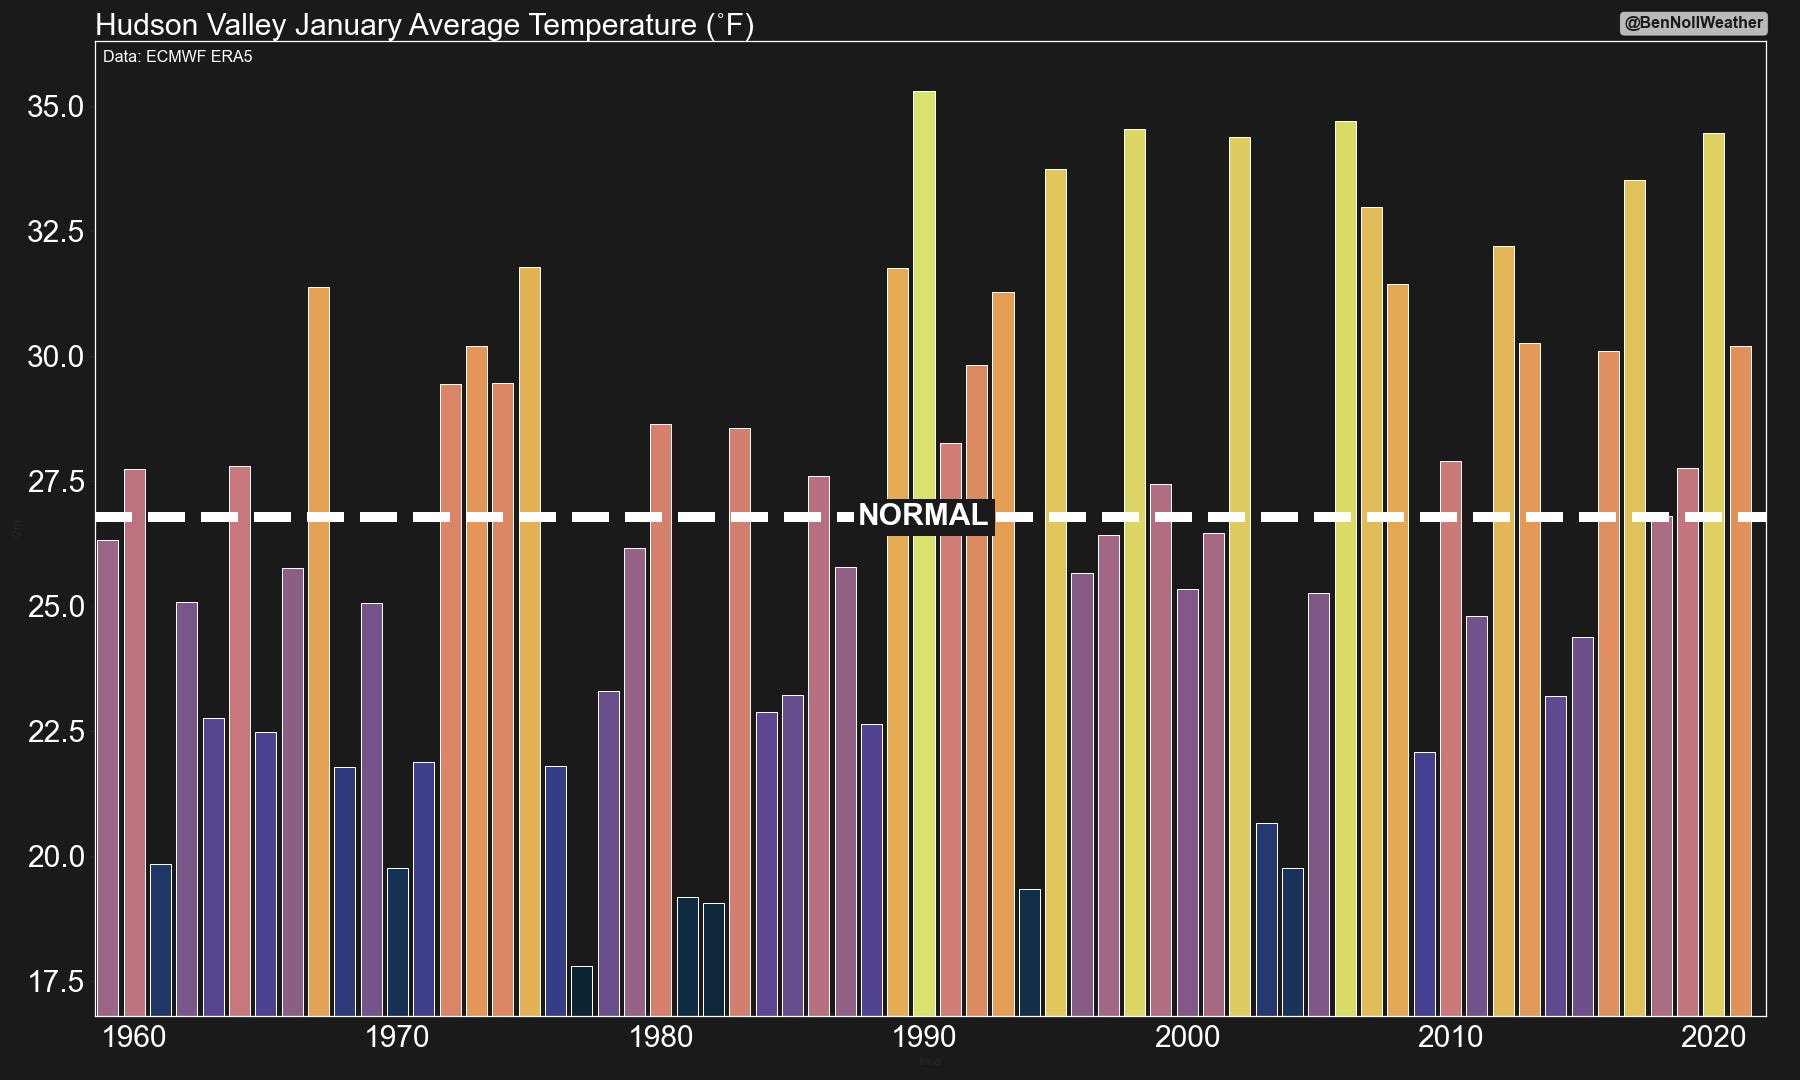
With a long-term average temperature of about 27 degrees, January is the coldest month of the year in the Hudson Valley.
The region’s coldest January happened back in 1977 when the average temperature was a frigid 18 degrees. The warmest was in 1990, which had an average of 35 degrees. This post will shed some light on where 2023 might fall on the spectrum.
Temperature wise, it’s looking closer to 1990 than it is to 1977 BUT it can still snow during a warmer-than-average January ❄️
I must say, it’s been nice to have some settled weather coincide with the holidays. Because of this, I’ve been able to take some time to relax and soak up the Southern Hemisphere sun… while the Hudson Valley forecast pulses through my brain more frequently than I’d like to admit 🙃


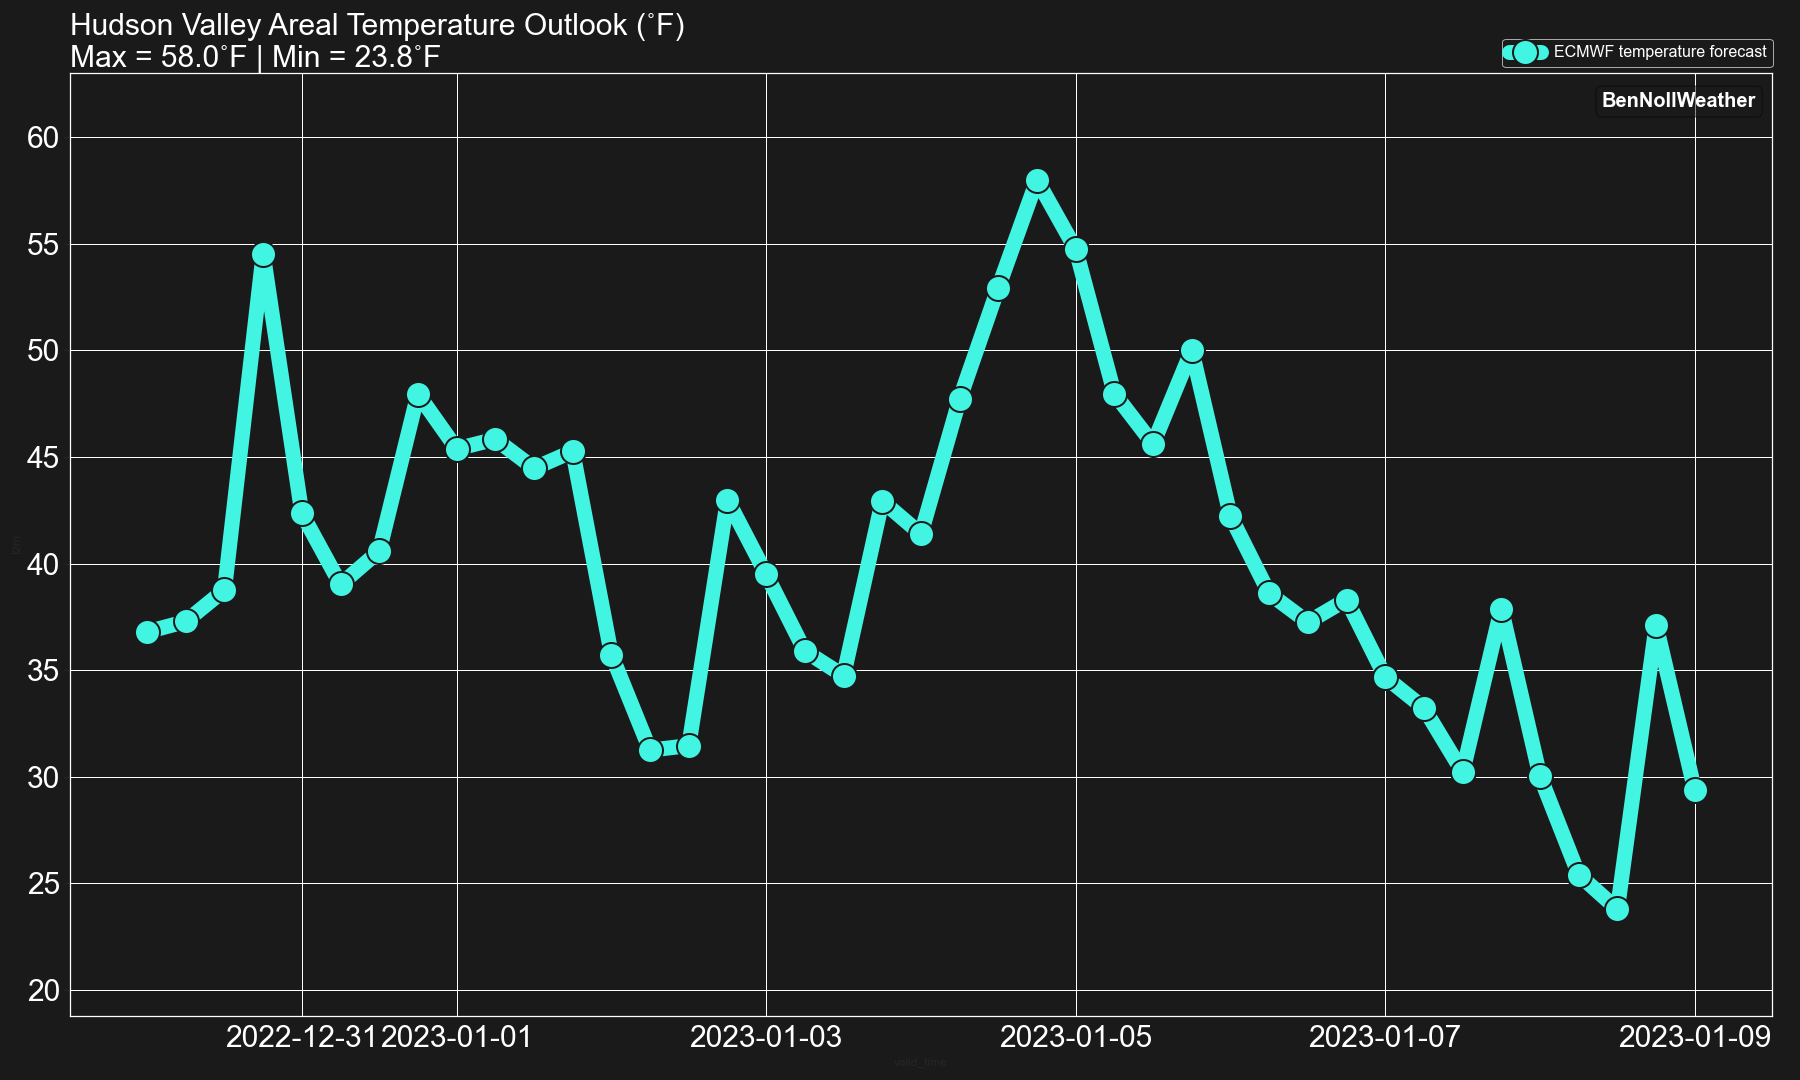
I’ve had a chance to settle in and scan the data for January. Summing it up in a sentence: the early month ≠ the mid and/or late month.
That is to say, the mild air (50s, maybe 60s!) that will be around to start the month probably won’t last 📉
Why will it be mild at first? The jet stream! This ribbon of strong wind in the upper atmosphere will blast across the Pacific Ocean with the fury of a fire hose, spraying mild air from coast to coast once it reaches the USA.
The early January jet stream pattern is visualized below. See how the strong winds (red and purple coloring) extend in a linear fashion from near China in the western Pacific to California in the eastern Pacific? This trajectory differs greatly from the one that caused the cascade of cold air earlier in December, during which the jet stream meandered way up to Alaska and then moved across Canada.
This set up favors warm —not wintry— air 🌡️
But it likely won’t last!
A climate driver called the Madden-Julian Oscillation, a cluster of tropical thunderstorm activity that circumnavigates the planet every 30-60 days on average, will likely become active over its “cold phases” for the eastern states.
The Madden-Julian Oscillation, or MJO for short, is another one of the teleconnections that forecasters monitor. Depending upon its geographical location (called a phase), it impacts global weather patterns in different ways. There are eight phases in total.
We can look at historical data to understand which of the eight phases are associated with unusually warm, cold, wet, or dry weather all over the globe, including the U.S. eastern seaboard.
For our neck of the woods, phases 8 and 1 during January typically increase the odds for cold and snow. These phases correlate with extra thunderstorm activity over South America and Africa.
This results in a change in global winds, including the jet stream pattern in the Pacific Ocean, favoring weaker winds in the North Pacific and a tendency for high pressure to develop there.
⬆️ What goes up must come down… when high pressure develops in the North Pacific, near the U.S. West Coast, the opposite pattern typically unfolds in the east: a jet stream dip ⬇️
A jet stream dip in the east can promote a pattern that is more favorable to wintry weather.
I’m favoring mid-to-late January for such a transition.
A storm, not associated with the possible pattern change later in the month, is worth keeping an eye on in the January 5th-7th time frame. However, forecast confidence is low at the time of this writing.
And sure enough, some of the long-range models are hinting at the pattern I’m suggesting.
🔴 See how the reds (warmer air) in the eastern U.S. on the first map change to blue (cooler air) on the second map? 🔵


In short, don’t get used to the warmer temperatures, because like the holidays, they’ll be gone in a flash 💨
Thanks so much for being a premium subscriber, fellow weather watcher. I’ll catch you next year! ✌️
Thanks for all you do! A few snow storms would be nice, other than that, bring on spring! Happy New Year!
Happy New Year Ben and Kate! 🎉