
🔮 Crystal ball gazing at summer & hurricane season 🌴
Premium update #35

The Hudson Valley experienced a summer tease this past week when the temperature reached 70 degrees on Wednesday and Thursday.
As that was happening, global producing centers were releasing their climate outlooks for the next six months, best characterized as a teaser about potential prevailing weather patterns in the seasons ahead.
If you’ve been following my premium posts for a while, you know what it’s called: Copernicus Day! A monthly holiday for weather nerds around the world 🤓
Some people look forward to Thanksgiving, Christmas, or a birthday, but for climate scientists, the 10th of every month is a holiday.
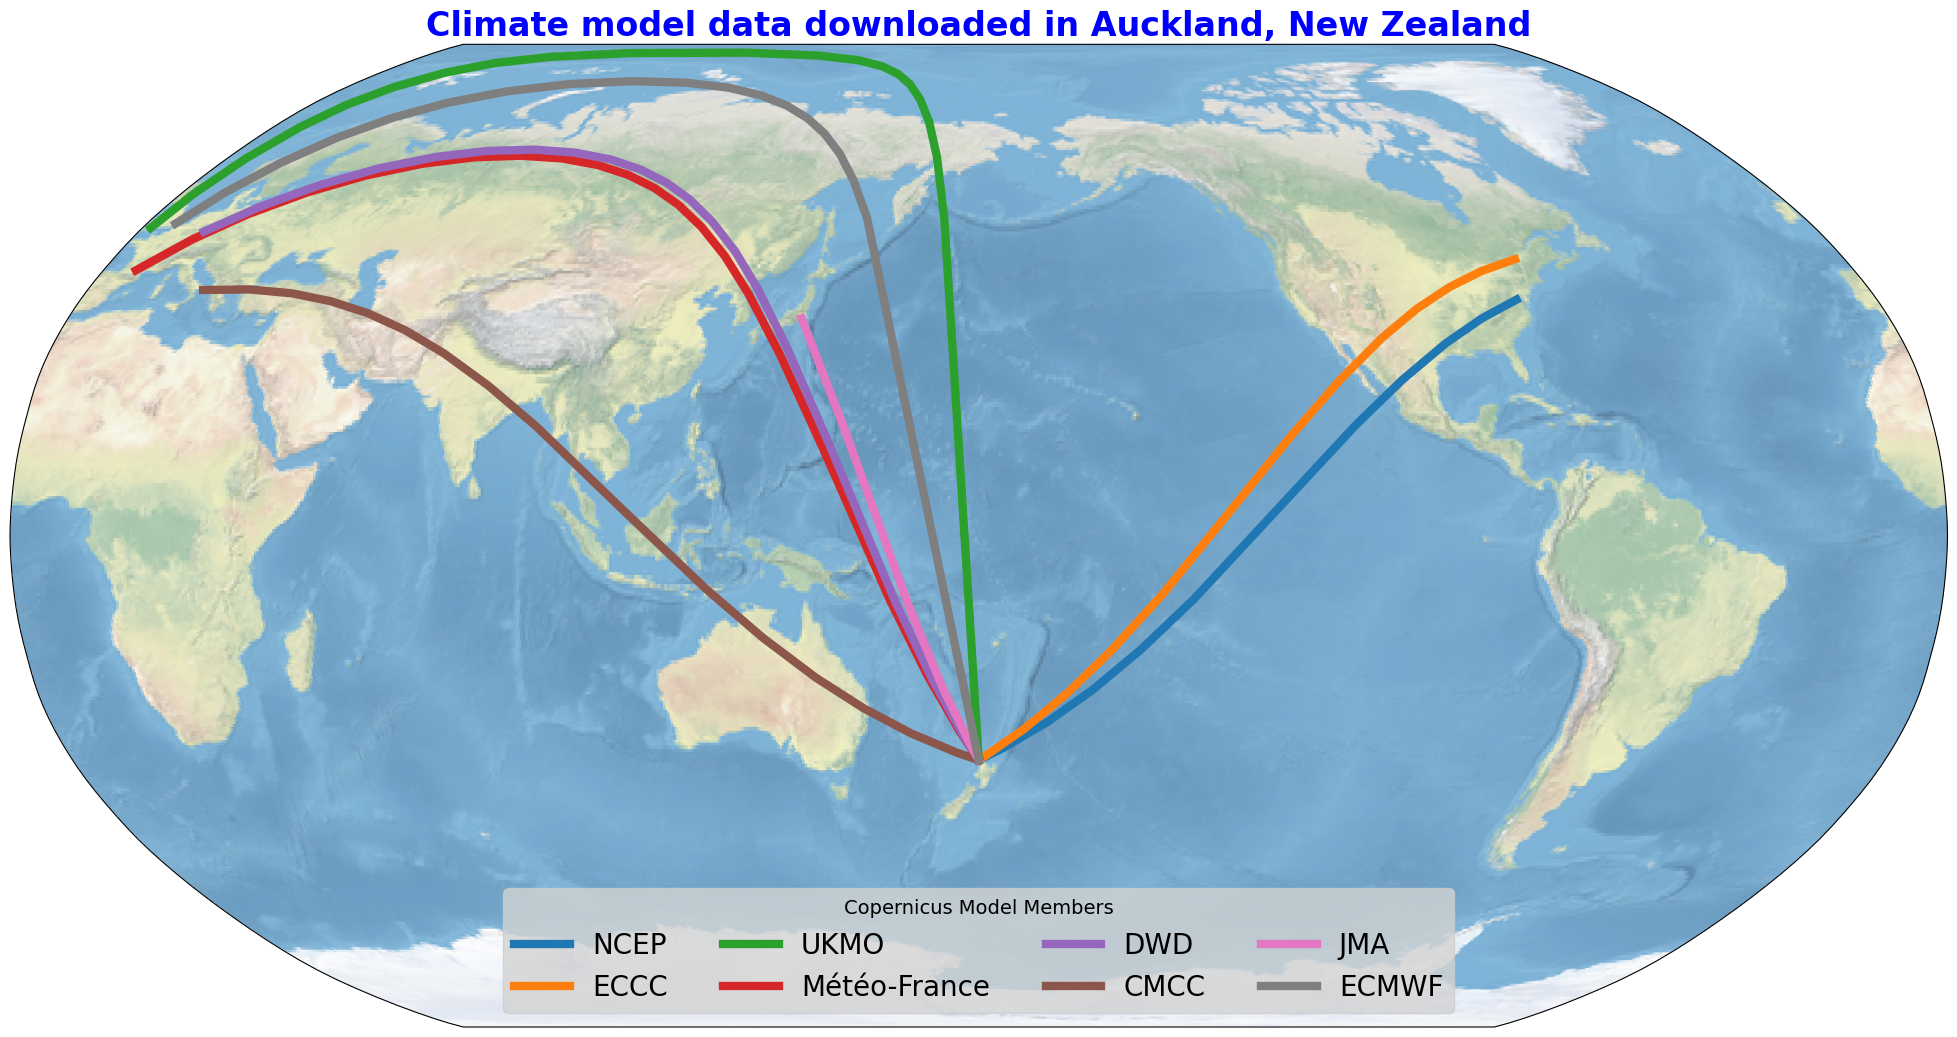
Since late 2019, it has marked the day on which a coordinated “data dump” from the world’s top meteorological centers occurs — the U.S., Canada, the United Kingdom, France, Germany, Italy, the European Center for Medium Range Weather Forecasts (ECMWF), and Japan all contribute. This data provides insights on general weather themes over the next six months.
Useful predictions are possible out 3 to 6 months, but skill gradually declines as the influence of the initial oceanic and atmospheric conditions that are fed into the models wane.
Every Copernicus Day, climate data from the United Kingdom, Germany, Italy, France, Canada, the U.S., and Japan, is beamed to my laptop at the bottom of the Earth in New Zealand. My Python scripts turn the data, encoded in a special meteorological file type called “.grib”, into colorful pictures that you or I can understand.
🔮 It’s time to do a little crystal ball gazing and look at those colorful pictures - what does the Copernicus data tell us about summer and hurricane season…?
