
Sun's out for spring break 😎
Update #543

It’s one of those years when you don’t have to travel to Florida to get some decently warm weather during spring break!
🌴 It’ll be in the 60s and 70s in our own backyard — not too shabby for early April. That’s about 10-15˚F above the average high (mid 50s).
There won’t be wall-to-wall sunshine every day, but it could be *a lot worse* this time of the year.
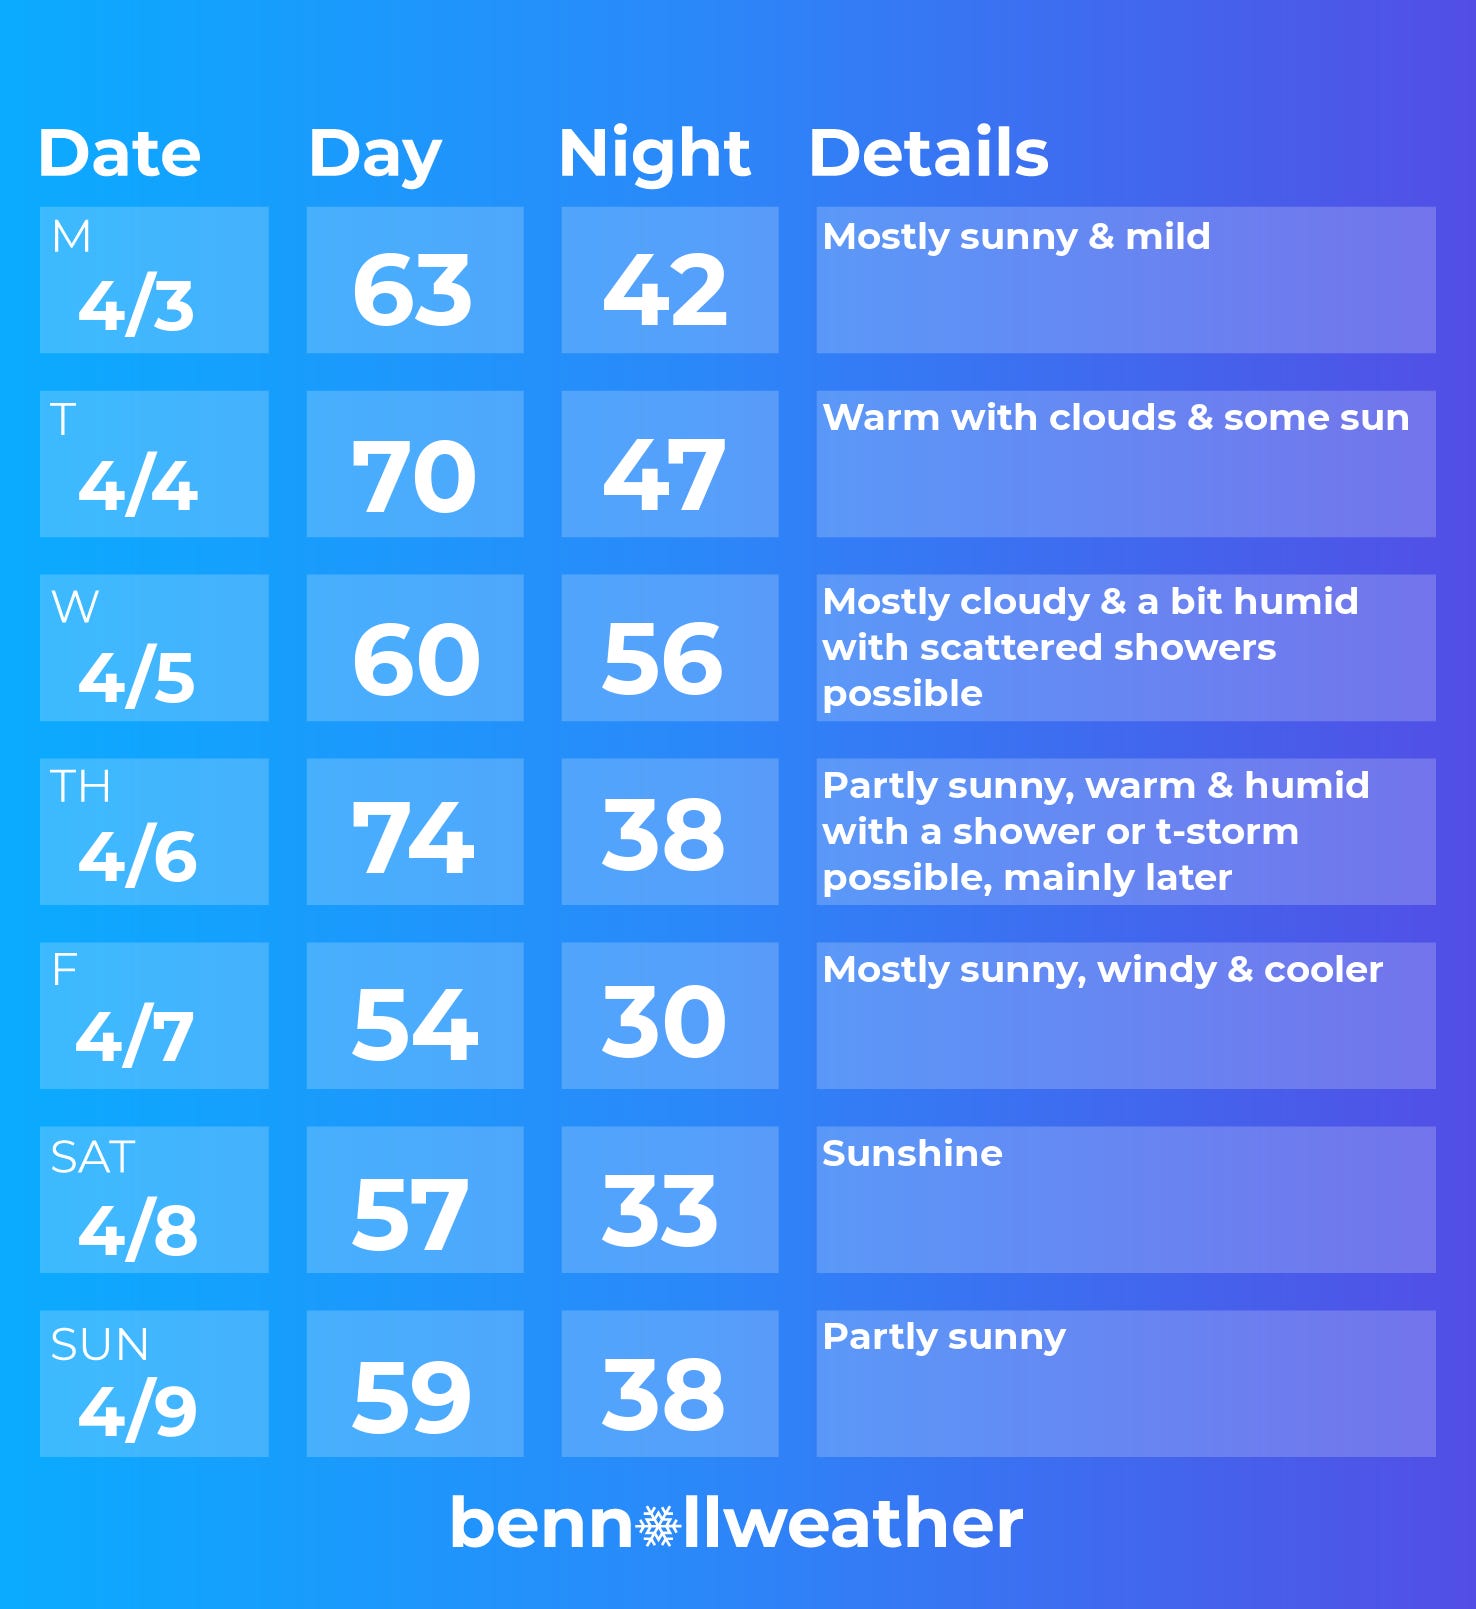
Monday: the week starts off on a high note with plenty of sun and above average temperatures 😎
Tuesday: most of the region looks to be on the right side of a warm frontal boundary, seeing temperatures in the upper 60s to near 70 with some sun; should the front end up farther south than currently forecast, the flavor of the day would be drearier
Wednesday: probably the cloudiest day of the week with a bit of rain possible (mainly later), but not a wash out
Thursday: looks like the warmest day of the week; a strong cold front which could bring a rumble of thunder in the afternoon, but the timing is still up in the air 🌡️
Friday: much cooler and windy behind the cold front 🌬️
Saturday: tranquility 👌
Sunday: probably fine
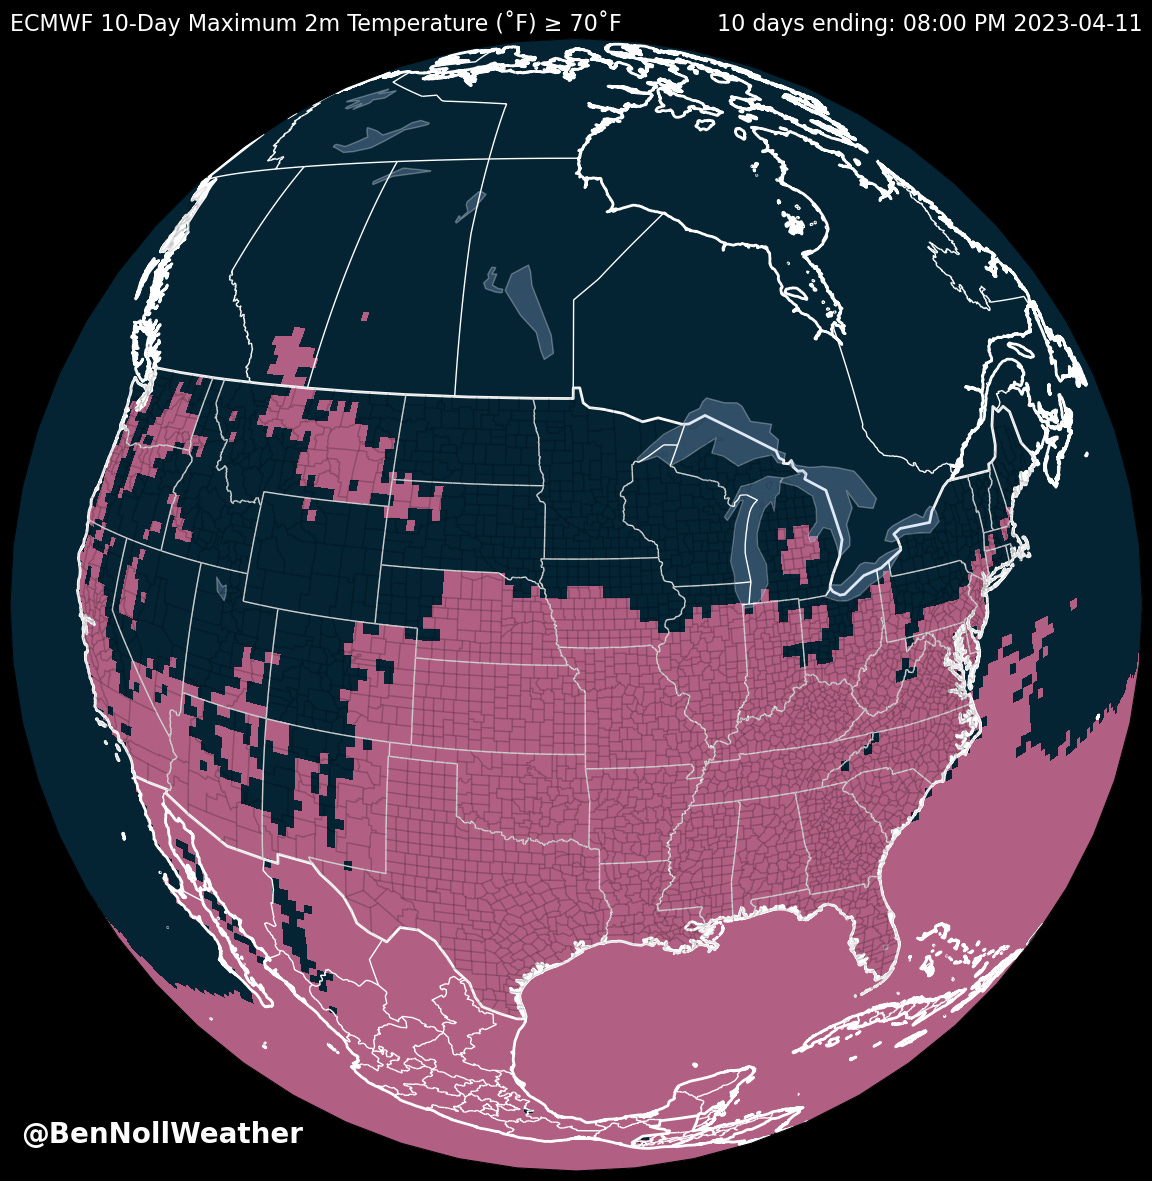
The map below highlights the states that will have the warmest spring break weather this year, with red-shaded areas expecting temperatures above 70˚F at some point during the next 10 days — the Hudson Valley included!
Of course, if you area headed to Florida, it will be a lot warmer than 70 — try 90 😬
Looking ahead to the week of April 10th, it looks cooler and a bit more unsettled, but it won’t last long.
‘Tis the season for sneezing
Before you go, I wanted to show you one more map that might make your eyes water or nose run just looking at it…
It’s called spring leaf index anomaly, which is a metric that tracks the start of spring by the timing of leaf out or bloom for species active in early spring.
The green colors (🟢) indicate an earlier-than-normal bloom — by as much as 10-20 days in parts of the Mid-Atlantic!
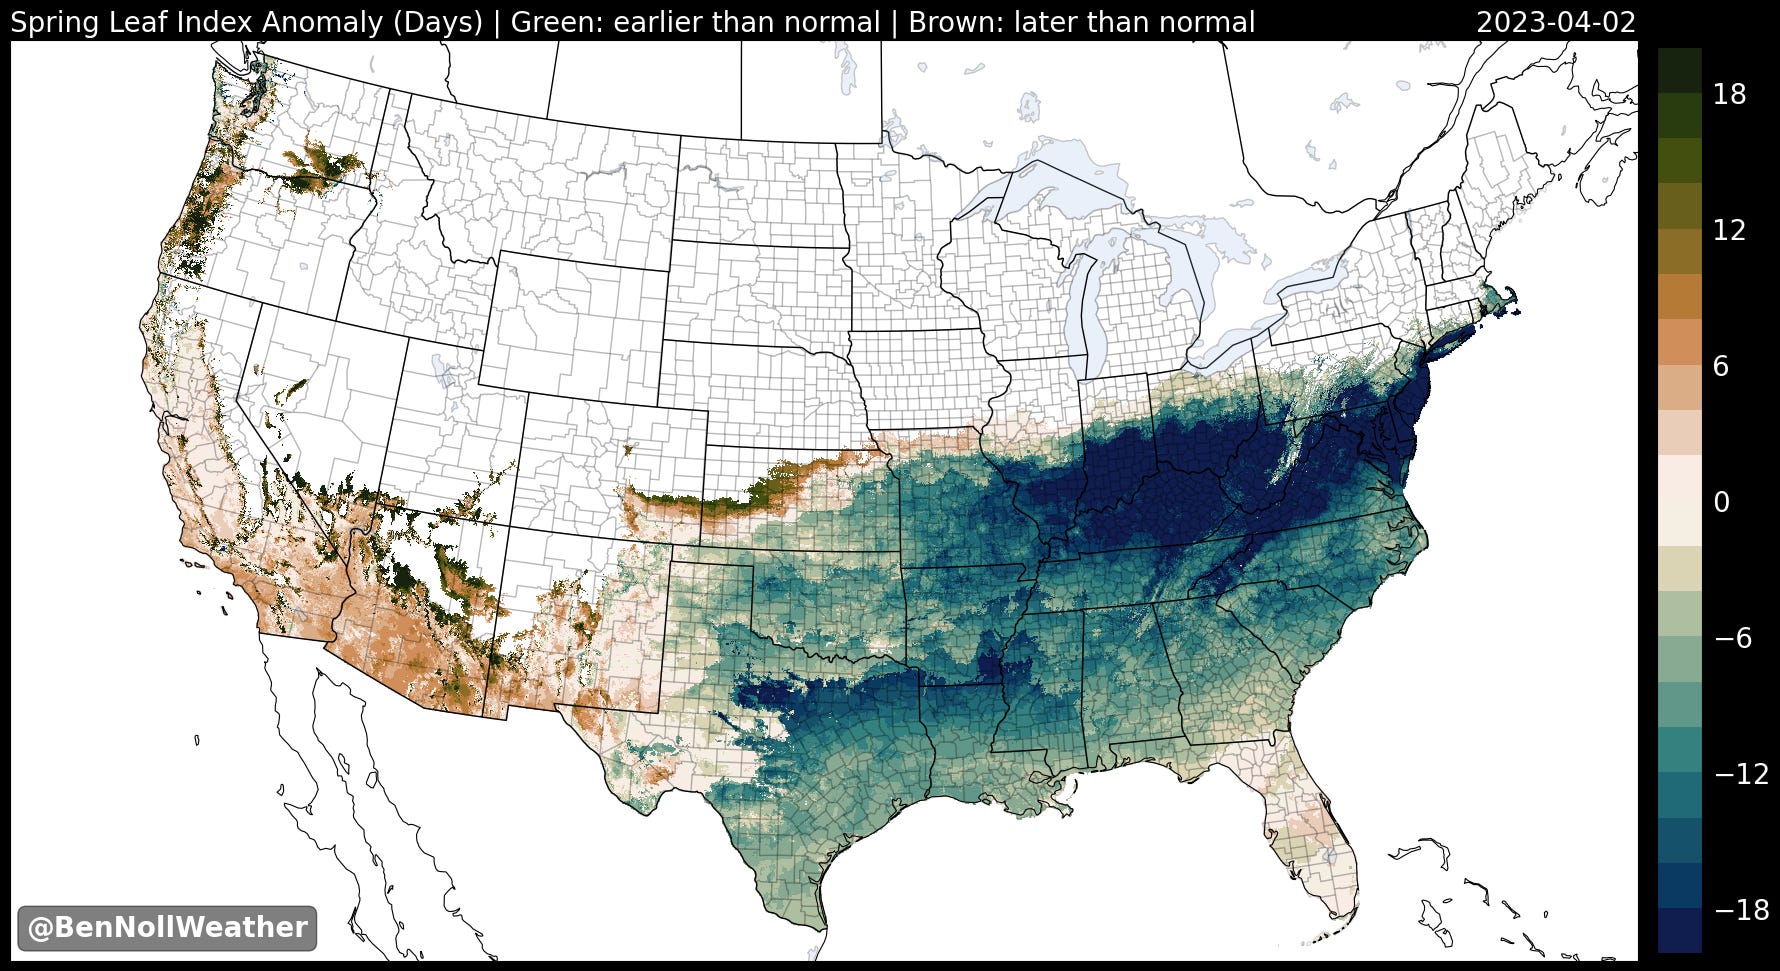
The data suggests that leaf out, or sneezing season, is about a week early in the Hudson Valley 🤧
Hope your week is full of fun — not pollen! 🙃
3rd least severe winter in 8 decades
The data is in: winter 2022-23 was the 3rd least severe winter in at least the last 83 years. My analysis below, for premium subscribers, shows that winters aren’t as bad as they used to be.
If you’ve followed me for a little while, you know how much I love using numbers and stats to tell a story.
I wanted to come up with a unique way of categorizing winter severity in the Hudson Valley to show how 2022-23 stacked up with winters past.
The results are pretty alarming: winters aren’t what they used to be around the Hudson Valley and 2022-23 was one of the “least bad” ever.
Hopefully this chart (mostly!) speaks for itself…

It’s a histogram, showing the distribution of historical winter severity. The left side of the plot is where less harsh winters are found — including winter 2022-23, which is way over to the left (denoted by the vertical white line).
Using historical wind, temperature, and snowfall data back to 1940, winter 2022-23 ranked as the 3rd least severe winter. Only 2001 and 2011 were less harsh.
In order to do this analysis, I first acquire datasets for temperature, wind, and snowfall — three meteorological metrics that can be used to describe the harshness of the weather.
I standardize or scale each of the individual variables so that they are directly comparable to one another and then add the standardized results together to get a single number that effectively describes winter severity (the numbers you see on the x-axis in the chart above).
Python allows me to work the data like playdough. It looks a little something like this:

Another way of looking at the data involves a color-coded “candy bar” chart which shows the severity ranking of every winter since 1940.
In the chart below, blue rectangles (🔵) indicate harsher winters and red rectangles (🔴) indicate gentler ones.
The trend is eminently clear.
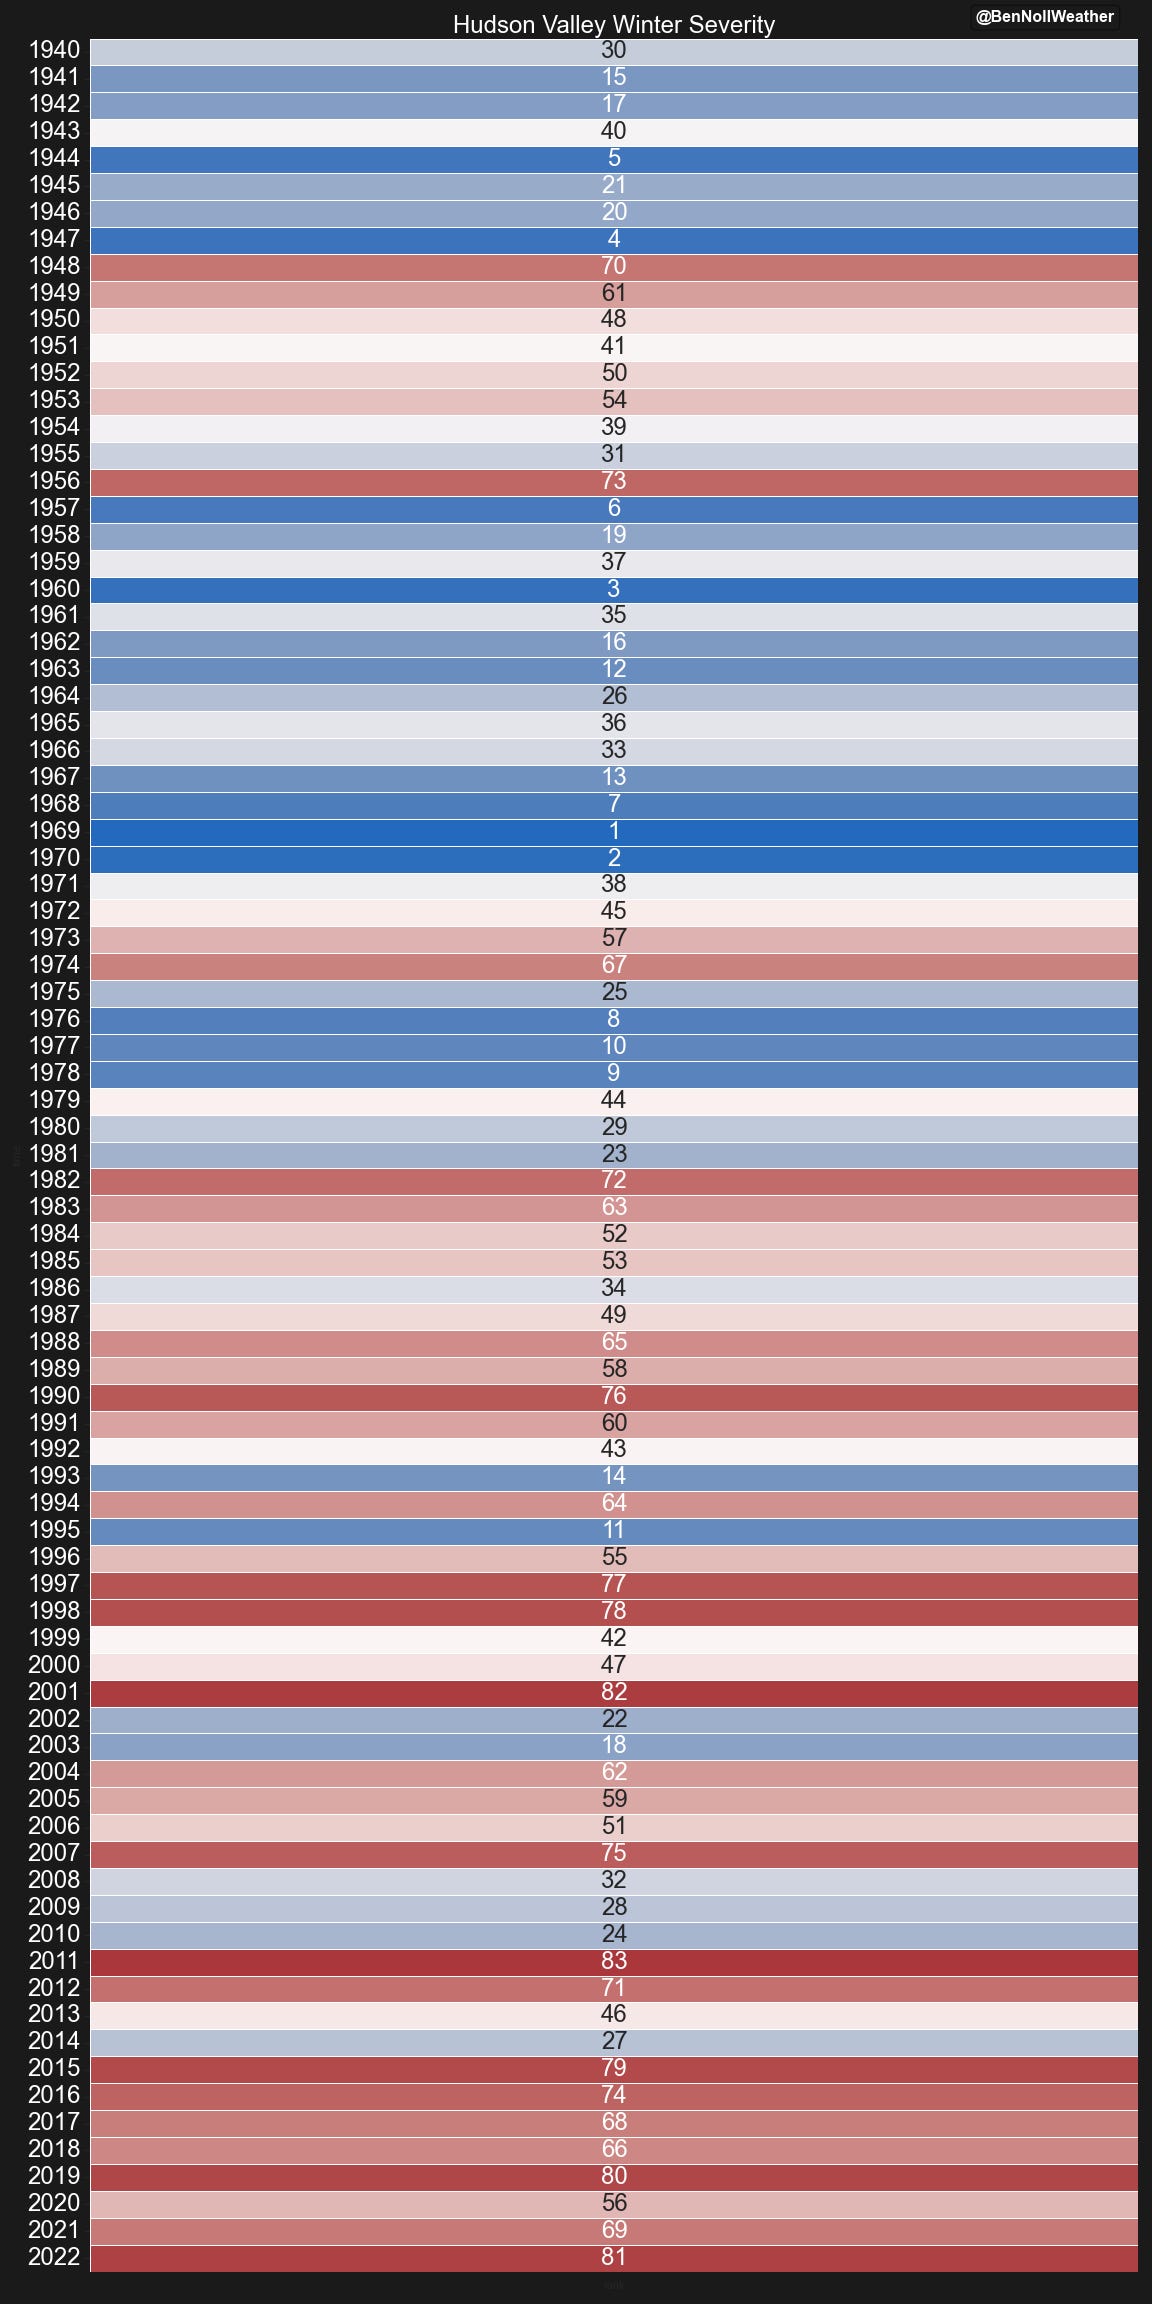
Since 2015, all of our winters have been no worse than the 56th most-harsh. Basically, not very impressive at all from a historical perspective.
At the end of the day, winter 2022-23 gave us 20-30 inches of snow across most of the mid-Hudson Valley — 50% to at most 75% of normal.

While I hope to continue to spread snow day magic across the Hudson Valley, I think I’m going to need a more powerful wand — and cast a spell to quell our warming trend.
Thanks for reading.
Thank you Ben. Enjoy your Winter!