Summer tease! 🩴
Update #544
That was fast. Find your shorts and flip-flops and dig out your sun glasses because Mother Nature is cooking up a summer tease this week! 🕶️
Less than a month ago, the story was snow. Now, it’s the week of April 10th and the temperature is forecast to soar well into the 80s — more like something we’d expect in late June.
The unusual warmth that Florida and the Southeast has recently experienced will be chasing spring breakers back north!
Enjoy it, because it won’t last too long.
Monday: good luck finding a cloud 🙅♂️ ☁️
Tuesday: warmer and a little windy in the afternoon
Wednesday: a few clouds hanging around, but windy and warm — the slightest of chances for a sprinkle
Thursday: feeling hot hot hot 🌡️ (record challenging warmth - the record high is 88 degrees)
Friday: feeling hot hot hot x2 🌡️🌡️ (record challenging warmth - the record high is 88 degrees again)
Saturday: still on the warm side, but moisture may approach from the south, bringing more clouds and a chance for scattered showers, mainly later in the day
Sunday: a front approaching from the west could bring scattered showers or a thunderstorm, but it’s unlikely to be a wash out
The map below highlights the states that will have the warmest weather during the next week, with red-shaded (🔴) areas expecting temperatures above 80˚F at some point during the next 7 days — the Hudson Valley included!
The summer-like weather will be short-lived — the week of April 17th looks to turn cooler.
New Zealand’s fruit
Have you ever heard of a feijoa? This scrumptious fruit, also known as a pineapple guava, is found commonly across the North Island of New Zealand.
Since moving here, it’s catapulted up my list of favorite fruits, sporting just the right amount of sweetness and not too much sourness.
Native to Brazil, these sweet treats need a certain set of climate conditions to thrive: basically, not too hot and not too cold. New Zealand ticks that box, as fruiting feijoa trees are found in abundance during early-to-mid autumn (now).
It’s a lovely dessert option and a prime candidate for being included as part of a fruit shake 😋
The best way to eat one is to slice it down the middle, then use a spoon to scoop out the meat.
If you ever come upon a fresh feijoa, don’t pass up the opportunity to try it!
Have a sweet week ✌️
So with all the warm weather coming up, you might be wondering: is it a sign of things to come this summer?
In the following section, for premium subscribers, I’ll briefly detail what a building El Niño might mean for the Hudson Valley’s summer weather 🌴
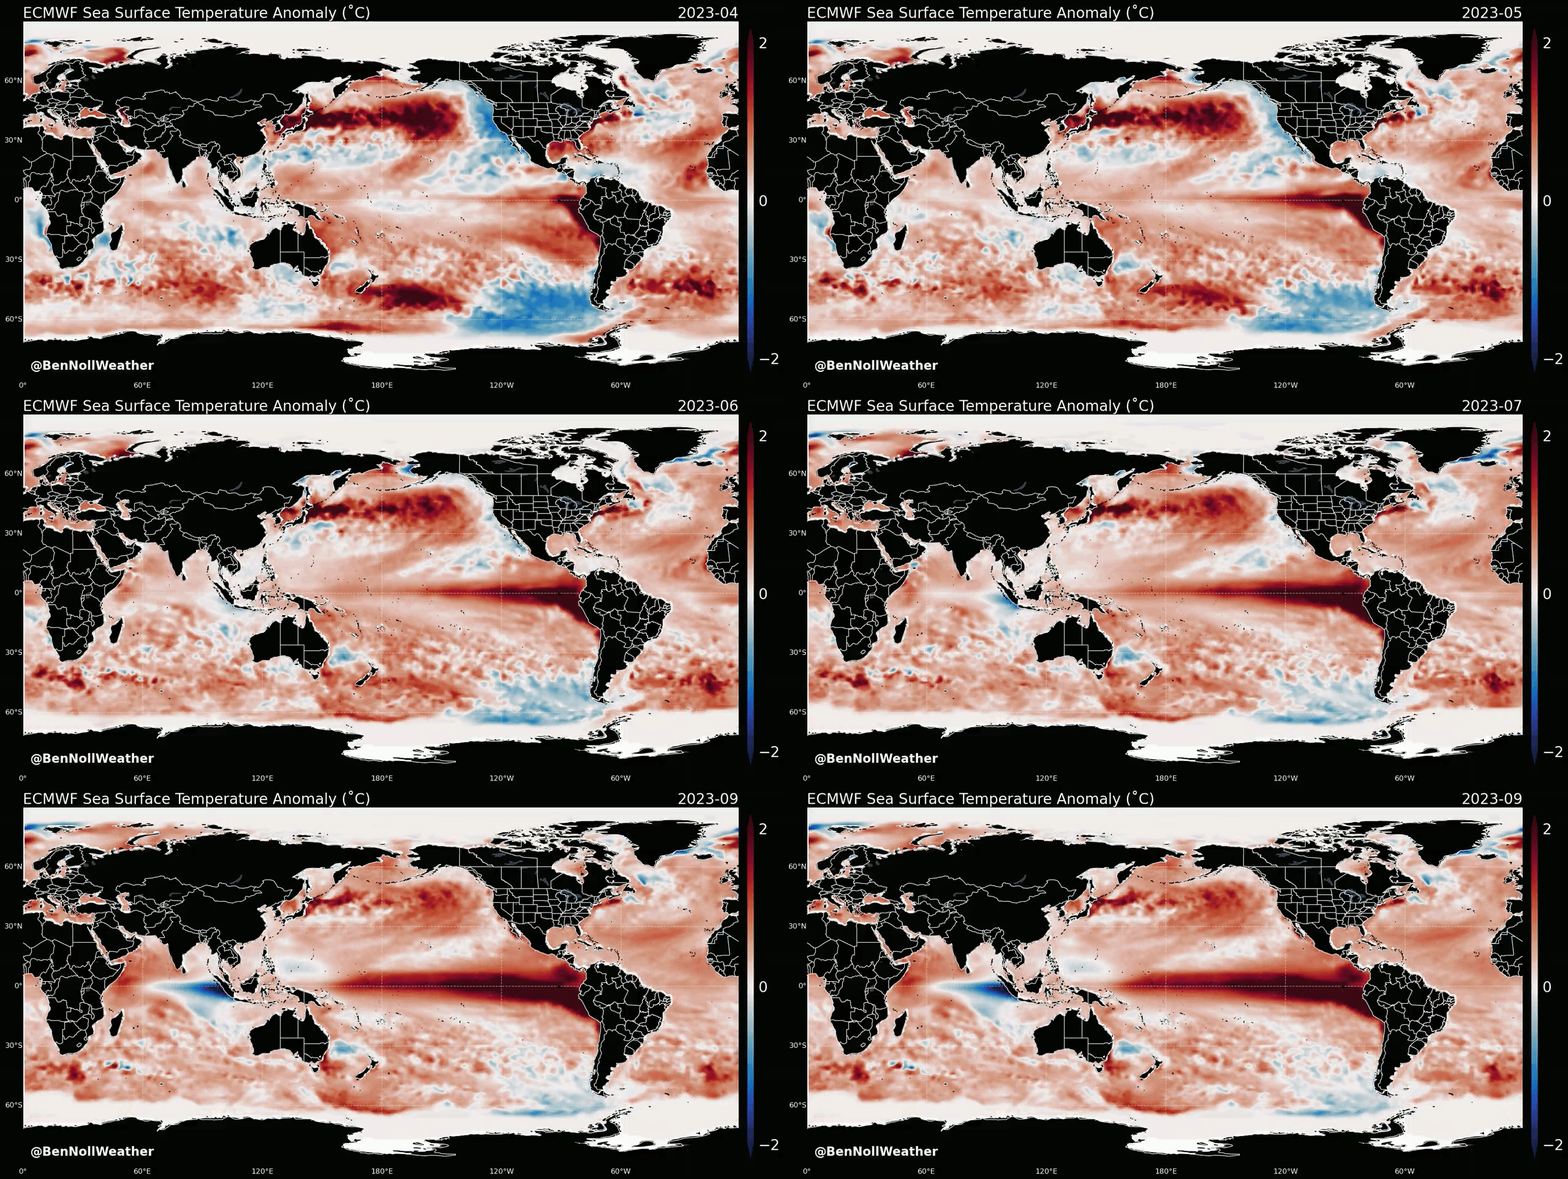
In previous premium posts, like this one, I’ve described the mechanisms behind the likely La Niña-to-El Niño transition in 2023.
Although this climate phenomenon occurs some 4000 miles away in the equatorial Pacific, it has flow-on effects to the weather in our backyard.
Trends in ocean temperatures, winds, and climate models have all been suggestive of the potential for an El Niño event by summer — and there is a growing chance for a strong event.
The stronger the event, the more of an effect that it can have on our climate.
Our two most recent, strong El Niño events occurred in 2015-16 and 1997-98.
So it begs the question: what was our weather like then and during El Niño summers past?
It’s important to remember that El Niño and La Niña are climate “drivers” — basically, what’s got its hands on the steering wheel of Mother Nature’s car. Every season there are multiple climate drivers, interacting in unique ways and on different timescales, ultimately causing the weather that we experience.
El Niño and La Niña don’t mean any one thing for our region, but they are part of the sphere of influence.
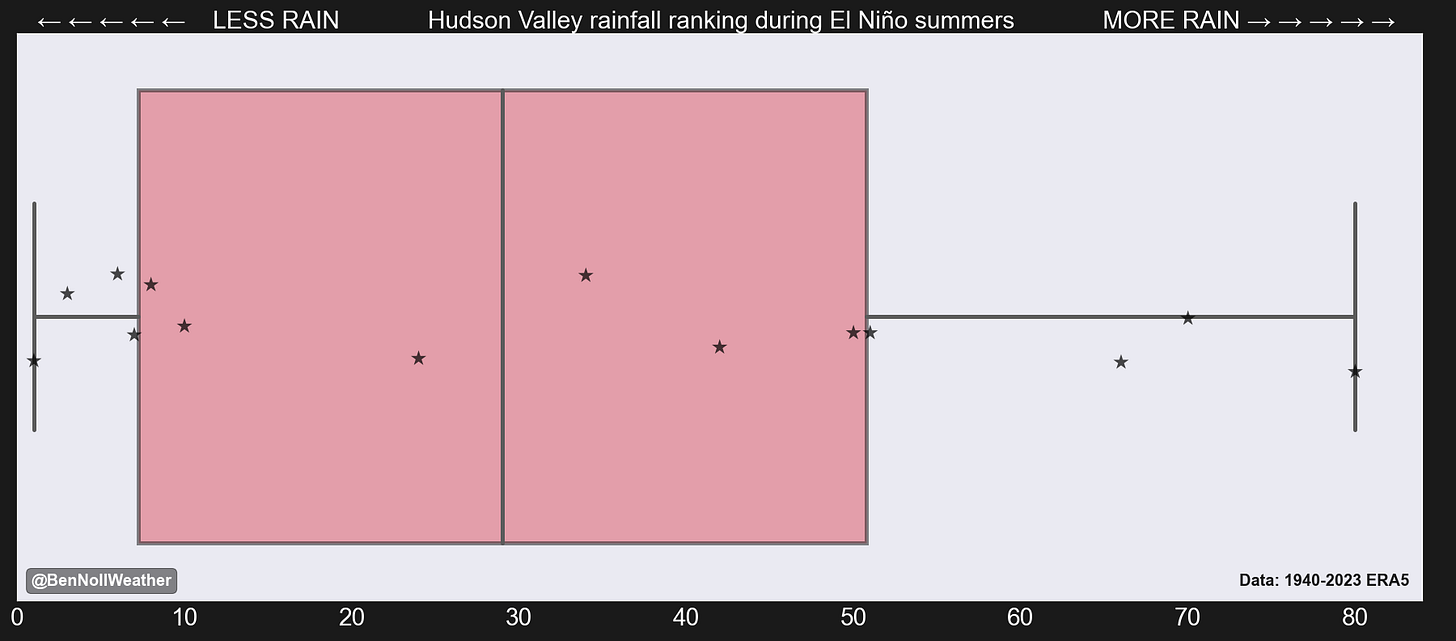
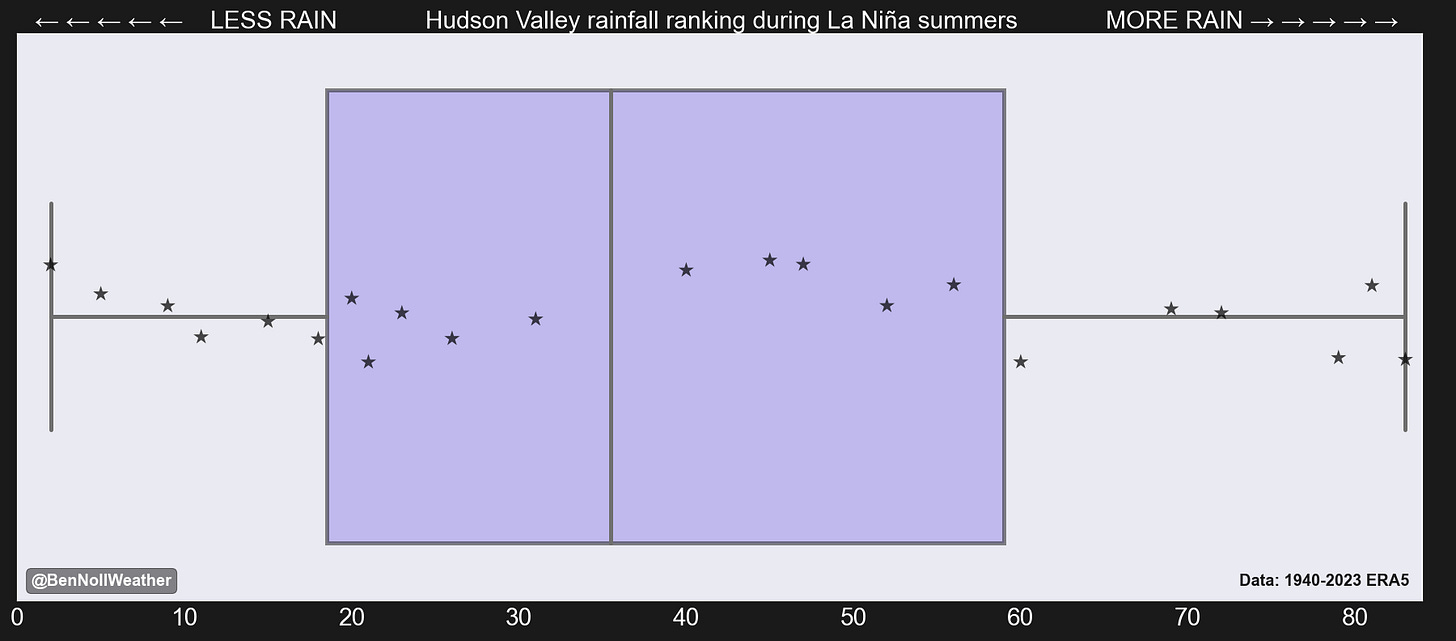
The box plots below show summer rainfall ranks during El Niño years (top) and La Niña years (bottom). These box plots enable the visualization of the distribution, or range, of summer rainfall for the years 1940-2022.
The line in the middle of the box indicates the median seasonal rainfall ranking for summer El Niño and La Niña episodes. For El Niño, it’s just shy of 30. For La Niña, it’s just shy of 40. The lower the number (ranking), the lower the seasonal rainfall.
That means El Niño summers have a lower median rainfall total than La Niña years on average in the Hudson Valley.
But there’s more to the story:
Remember last summer? It was a top-5 dry summer across the region and the driest La Niña summer on record.
Of the 14 El Niño summers since 1940, 6 were in the top-10 driest, but wetter than normal El Niño summers can still happen (5/14 years or 36%).
Of the 22 La Niña summers since 1940, 3 were in the top-10 driest.
One of the reasons behind less summer rainfall during El Niño (on average) is because the tropical Atlantic Ocean is typically less conducive to tropical storm and hurricane activity.
So that’s rainfall — what about temperatures?
The top plot is for El Niño and the bottom plot La Niña. The higher the number (ranking), the hotter the summer temperatures.
This tells an interesting story: on average, El Niño summers are cooler than La Niña ones! Does that mean that we won’t have 90 degree temperatures and high humidity at times during the season? Nope!
The influence of climate change is allowing our average temperature to increase and also shifting the distribution of temperatures toward higher values.
Thus, the average influence of El Niño on summer temperatures in 2023 will be different from the big event in 1997.
The last big El Niño, which developed in summer 2015, was the 21st-hottest summer on record in the Hudson Valley.
If I was a betting man, I wouldn’t be expecting a cooler than average summer in the Hudson Valley.
So there you have it — a little primer on possible summer patterns in the Hudson Valley: if history is a useful indicator, we could be in for another drier-leaning season (with a lower tropical storm risk) but maybe a little less hot and humid than recent years… if we’re lucky.
Thanks for reading.


