Hudson Valley 2021-22 winter outlook
Hey there Hudson Valley resident, Northeasterner, or winter weather fanatic!
If you are interested in learning more about the types of weather patterns we may face this winter, this post is for you.
Each year, I grapple with doing a long-form piece or something bite-sized. Last year, I received some useful feedback: “Ben Noll, most people just want to know if this winter is going to be bad or not! Get to the point!”
Ok, received, loud and clear!
This year, I’ve decided to do something that I hope is the best of both worlds. If you are here for an executive summary, read on a little further and you’ll find the answer. Keep scrolling and the scientifically inclined will find a deeper dive on climate drivers, models, analogs and more.
So don’t worry, if the El Niño Southern Oscillation and Sudden Stratospheric Warming events aren’t really your thing, don’t worry, I got you 😉
In New Zealand, this is what I do for a living: assess long range weather and climate patterns to help people plan for impactful events like drought, hurricanes, and heatwaves. I’m in my element with this post.
Oh, one more thing before we get into it:
I provide all of my forecasts and outlooks free of charge. For some perspective, I started writing this on September 4th. It takes hours and hours to put all of this together. Many of the graphics are hand-crafted in Python. So, if you find it useful, interesting, or want to support similar outlooks in the future, please kindly consider a donation by clicking the button below.
You can also provide support by purchasing some of my official 2021-22 winter merch! I’m excited to announce this year’s motto: BenNollWeather, CEO of snow 👨💼 ❄️
You can use promo code “winter2122” for 20% off (valid until October 31st)!
Without further ado, I’m pleased to present to you the winter outlook for 2021-22.
Winter 2021-22: the short version
So will the winter be bad? Such a simple, yet complicated question! What’s bad to me is different from what’s bad to you is different from what’s bad to the next person.
I think one of the simplest ways to qualify the “badness” of the upcoming winter is by comparing its potential to last winter.
Did you think last winter was bad? By the books, temperatures were near average and snowfall was above average. The Hudson Valley regional average total snowfall was about 60 inches, 20 inches above the long-term normal.
Last winter is still relatively fresh in heads, so comparing it to the upcoming winter can be a useful exercise.
So what if I told you that something in the ballpark of last winter is a good starting place for the upcoming winter? Now we’re getting somewhere!
Five things you should know about winter 2021-22
Something in the ballpark of last winter is probably a good starting place for the upcoming winter…
An elevated chance (80%) for either normal or above normal seasonal snowfall; a 20% chance for below normal snowfall
January, February, and possibly March are looking like the busiest months. There’s a 50-50 chance for some accumulating snow in November and a 60% chance for at least 10 inches in December ☃️
It’s not looking like the coldest winter ever, but it can still snow even if temperatures aren’t colder than average
A normal to above normal amount of weather-related school impacts are predicted
Last year, there was a trace of snow on October 30th but the first inch didn’t fall until December 14th. The year before that, the first snow fell at the start of December. And the year before, it was mid-November.
Using recent history as a guide, our first snow event might not be far off!
Winter 2021-22: the long version
⚠️ Warning! This part of the post will go deep into the meteorological weeds. I encourage you to read on, but it’s geared toward weather nerds 🤓
📞 Teleconnections
Ever hear that one before? Is it a more sophisticated way of saying you’re making a phone call or connecting with someone over text? Not exactly! Teleconnections are climate patterns related to one another over long distances. Think of it like a weather pattern in one part of the world making plans with another in a different, distant part.
This includes things like El Niño and La Niña, which you may have heard of before, and other climate indices such as the Indian Ocean Dipole, North Atlantic Oscillation, Arctic Oscillation, Pacific Decadel Oscillation and Quasi-Biennial Oscillation (try saying that five times fast 🙃).
A climate scientist tries to identify which of these climate drivers will influence the prevailing weather patterns in the seasons to come. Put another way, the goal is to try to figure out what has its hands on the steering wheel of Mother Nature’s car.
Spoiler alert: this car has a passenger seat driver and multiple rows of back seat drivers!
It isn’t possible to predict the weather on Christmas Day, months in advance (hate to break it to you, but the Farmers Almanac is pulling the wool over your eyes). It is possible to gain a handle on the most likely types of weather over the coming months in a broad sense. Think: milder, colder, rainier, snowier…
Sudden Stratospheric Warming
Note: the section below was written based on information during September. During October, things changed a bit, but it’s still a piece of the winter forecast puzzle that you might like learning more about.
This winter, we’ll potentially have a unique climate driver to make things more interesting. It’s called a Sudden Stratospheric Warming (SSW for short). Let me guess: the first thought that came to your mind is warmth? 🌴 Am I right? Well guess what! It actually means the opposite, at least in the part of the atmosphere where we live 😱
About six times period decade, the stratospheric polar vortex, sitting high up in the atmosphere above the North Pole during winter, weakens substantially when a sudden warming and west-to-east wind reversal occurs.
Patterns in the stratosphere can sometimes become connected (coupled is the technical term) with the patterns in the troposphere — the part of the atmosphere that we call home. When this happens, it tends to result in lobes of freezing Arctic air escaping southward into the more populated parts of the Northern Hemisphere, such as the United States, Europe, and Asia 🥶
Here’s the catch: we don’t 100% know whether this SSW will happen or not, but if it does, it could play a meaningful role in our winter weather patterns.
The climate models (more on those in a bit) that are used to identify long-range climate patterns and teleconnections (there’s that word again) have been picking this SSW for months, since June to be exact. It’s unusual to have a signal for a possible event a half year in advance. From a forecaster’s perspective, it’s actually quite luxurious!
You can learn more about this phenomenon by following this link or the clicking on tweet thread below.
In mid-October, a fresh round of stratospheric outlooks arrived. This time, the guidance wasn’t as bullish on a sudden, strong warming during December but instead showed a marginally weaker vortex at times during the winter season, particularly during January. Despite the shift, the general theme remained: a weaker polar vortex looks possible going forward, which can increase the risk for streamers of frigid, Arctic air to find their way into populated parts of the Northern Hemisphere.
La Niña
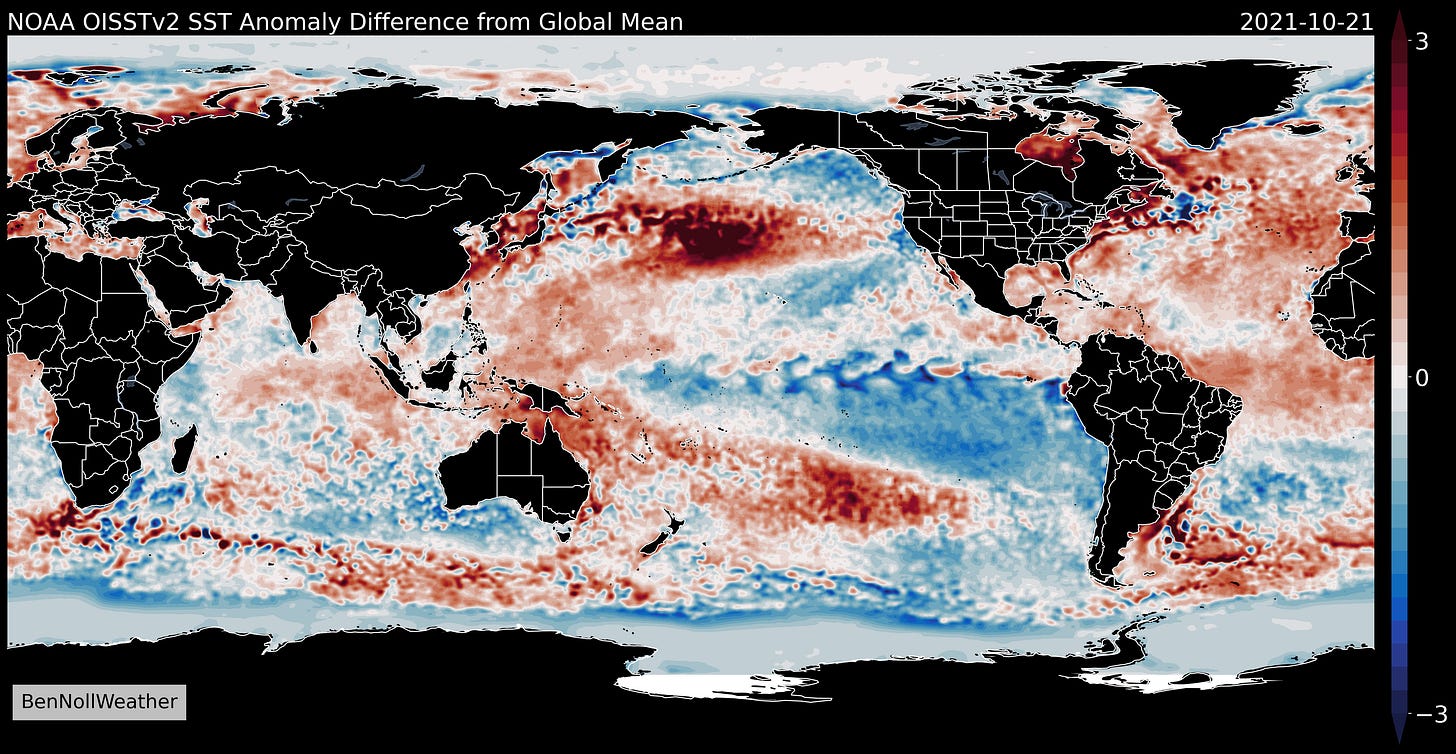
🌊 We’re going to shift gears now to the tropical Pacific Ocean, some 5,500 miles away from the Hudson Valley. Like last year, the ocean water in this part of the world is cooler than normal by about a degree and a half Fahrenheit. This is consistent with a moderate La Niña climate pattern.
El Niño and La Niña make up the “El Niño Southern Oscillation” or ENSO for short. ENSO is a natural cycle of sea surface temperatures in the equatorial Pacific Ocean. El Niño is the warm phase of the phenomenon, during which ocean temperatures from South America to the central Pacific Ocean become warmer than average. In the opposite phase, La Niña, cooler than average ocean temperatures encompass the same region. The changes in ocean temperatures arise from variations in the trade winds that blow in the tropical latitudes.
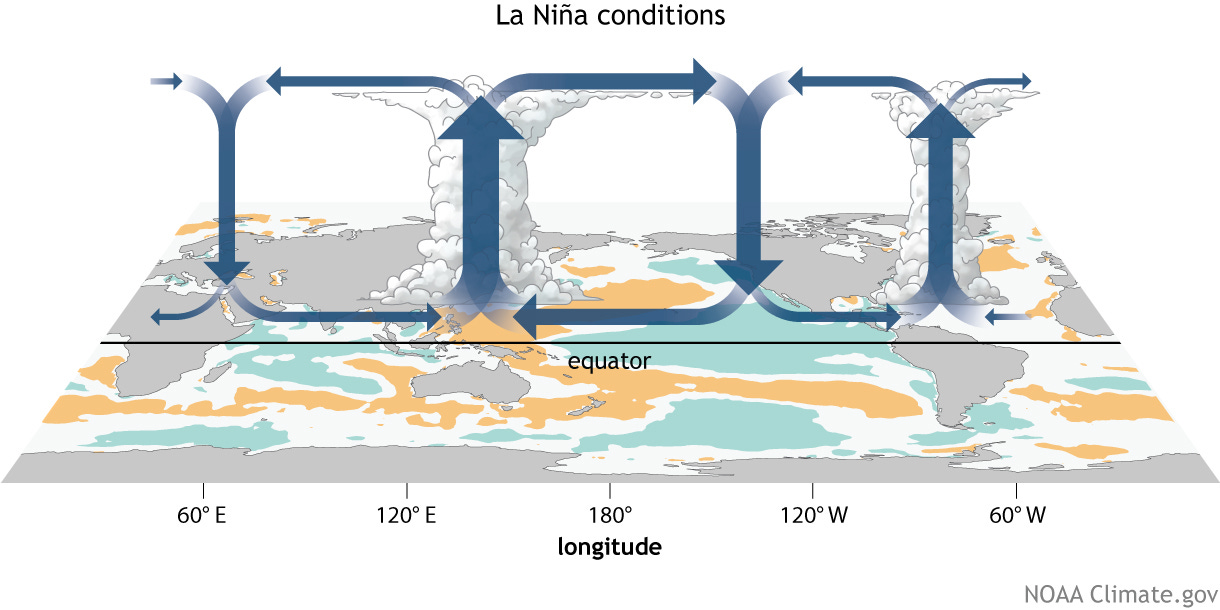
Why does ENSO matter to the Hudson Valley? Anomalies in the tropical Pacific Ocean have an impact on the atmosphere. Warmer tropical seas are a focal point for rising air, causing rain, thunderstorms, and clouds. Where the seas are cooler, subsidence (sinking air) is more likely, bringing sunny and rain-free conditions. The patterns of stormy and calm weather across the global tropics represent the Walker Circulation.
The diagram below shows the typical Walker Circulation setup during La Niña. Stormy weather tends to occur over a warm pool of ocean water in the western Pacific Ocean.
Green (orange) = cooler (warmer) than average sea temperatures
Anomalies, or deviations from the norm, in the Walker Circulation impact air pressure patterns not just in the tropics but across the mid-latitudes, including the United States.
In the Hudson Valley, winter tends to be a little colder (especially January) and have a little more precipitation on average when La Niña is strong. This is because La Niña typically results in a strengthening of the polar jet stream across the northern tier of states and a weakening of the warmer sub-tropical jet stream.

Weak La Niña winters can go either way across the region. Right now, La Niña is intensifying quickly and will peak in December or January — it will have an impact on U.S. weather patterns going forward.
Some of our snowiest winters occurred during La Niña years! ❄️
The ENSO phase is a good starting place for a climate outlook, but it is far from the finish line.
Seasonal climate predictability can also be gleaned from air pressure patterns in the North Atlantic Ocean, ocean temperature anomalies along the U.S. coastlines, ocean temperature anomalies in the Indian Ocean, the solar cycle, and a tropical weather cycle called the Madden-Julian Oscillation.
I won’t go through all of these, but it demonstrates the complexity of long-range prediction.
Analog years
🔮 In order to try to predict the future, we must first learn from the past — this applies to crafts of all kind, not just weather and climate.
When it comes to the weather world, past years that have similar background climate characteristics to the present are called analogs (analogues in British English, the spelling here in New Zealand 😛).
Forecasters use different techniques to identify analogs, but one popular way is by matching the ENSO phase. So this winter, a starting place would be to identify past La Niña winters.
My particular technique involves matching the way the atmosphere is responding to ENSO through a variable called velocity potential, taking it a step further from ocean temperatures. Sometimes the ocean can be saying one thing and the atmosphere doesn’t necessarily agree. I’ve found success in this method over the years.
It’s important to point out that there’s no such thing as an exact match, so an average of several analog years tends to be more powerful. By blending the years together, it can be determined if a season is more likely to be mild, cold, rainy, snowy, or dry. In a nutshell, if several analog years have a similar (dissimilar) flavor, forecast confidence increases (decreases).
My analog years, along with the amount of snow that fell during each, are listed in the table below. The months with the most snowfall are highlighted in yellow.
Remember, the Hudson Valley average annual snowfall is around 40 inches 📏
As you can see, a majority of the analogs (80%) are keen on a winter season with either near or above normal snowfall. Just two of the analog winters (20%) featured below normal snowfall.
While the average snowfall during the analog years is 56 inches, the spread is quite large: 22 to 96 inches. 1995-96 was a special winter that I don’t think we’ll be repeating verbatim anytime soon.
Digging into the stats further, if we drop the extreme low (22 inches) and extreme high (96 inches) and then take the average of the eight remaining seasons, we’re left with 44 inches. The median is 59.5 inches. A range of 40-60 inches covers it, which qualifies as 100-150% of the norm.
The models
When it comes to long range forecasting in the year 2021, meteorologists and climate scientists have more tools on their belt than any generation before.
Data from climate models is now easily accessible, enabling informed discussion and decisions based upon the very latest long-range data.
There are about a dozen well-known (in the weather world) seasonal climate models. These sophisticated simulations run on supercomputers at global producing centers like NOAA, Environment Canada, the Australia Bureau of Meteorology, the European Centre for Medium Range Weather Forecasts, the UK Met Office, and more. These models consider the current state of the ocean-atmosphere system and predict general circulation patterns (large-scale air flow) out 6 to 12 months.
The climate models are improving as advances in supercomputing have afforded dramatic increases in model resolution, which increases precision and accuracy. More data is fed into the climate models than ever before as satellites seamlessly sample the state of the ocean, atmosphere, and cryosphere (ice sheets) on a daily basis — this helps with predictability.
Useful predictions are possible out to about 3 to 6 months, but skill declines thereafter as the influence of the initial oceanic and atmospheric conditions that are fed into the model wane.
I post these types of models on my Twitter feed from time to time, with colorful depictions of pressure, temperature, rain, snow, and more.
The output of these climate models is typically assessed as an anomaly or a difference from average. It allows someone to clearly see what parts of the world are most likely to be warmer 🔴 or colder 🔵 than average and wetter 🟢 or drier 🟤 than normal.
Another technique that I use is comparing the model output from last winter to this coming winter. This allows for an apples-to-apples comparison of world through the model’s eyes.
Temperatures
Here’s how last winter was looking this time last year in terms of temperatures. An average of two of the best climate models was suggesting 2 to 3˚F above average for December 2020-February 2021 in the Hudson Valley.
While December and January ended up being above average, February was a balancer, coming in with below average temperatures (and 36 inches of snow). So you might say that for last winter, the models get partial credit.
How does this compare to the forecast for this coming winter?
Pretty similar! But if you look closely, the signal for this winter is slightly cooler than last winter.
More specifically, we can focus on monthly temperature trends in Hudson Valley. To do this, I take an average of all temperatures in a square centered over the region using two of the best long-range forecast models.
December is shown to be the mildest winter month relative to average, followed by January and then February.
It’s well worth noting that we don’t need below average temperatures for it to snow.
As the climate continues to warm, it may be the case that mixed wintry precipitation becomes more likely across the lower elevations of the Hudson Valley while the white stuff is more common in our mountainous points and across the Catskills.
Precipitation
Last winter featured near normal amounts of precipitation which translated to above normal snowfall.
This time last year, the models were indicating near normal precipitation for the Hudson Valley and near to above normal totals across the wider Northeast.
The upcoming winter is indicated to be quite similar last winter. Both coastal and interior storm tracks could potentially be active, as signaled by a swath of green across the Midwest and interior Northeast.
Interior storm tracks tend to bring mixed precipitation while coastal storms usually give the Hudson Valley a better chance for all snow.
Taking things a step further, here’s how monthly precipitation trends are looking locally.

Near normal precipitation is predicted during December, a little less than normal during January, and more than normal during February.
Snowfall
Climate models also predict seasonal snowfall. Unlike air pressure, temperature, and precipitation, this isn’t a field that is routinely assessed by climate scientists.
I’ve been tracking its performance over the last few winters. While it was hit-and-miss last winter (generally not snowy enough in the Northeast), it was quite good the winter prior.
One of the challenges with last winter’s outlook was that the analog-based guidance was notably snowier than the models. Heading into last winter, we were coming off two consecutive winters of low snowfall, so there was a natural inclination to lean toward a less snowy season. Even with the conflicting signals, last winter’s outlook spoke to an elevated chance for snowier-than-normal conditions in the Hudson Valley.
I think this type of information can be useful in identifying broad themes but not finer detail: does the model expect more or less snow in a certain part of the country?
Similar to last winter, the model guidance is less optimistic than the analogs when it comes to our snowfall chances — it leans slightly toward less snow than normal for the Hudson Valley and much of the U.S., in fact. I think this is overly pessimistic, but we’ll see.
Final thoughts
If you made it to the end of the post, congrats! Do you know what SSW stands for (without looking)? 😅
I hope you learned a thing or two. As the leader of a project tasked with issuing long-range climate outlooks for New Zealand, it’s my job to bridge the gap between day-to-day weather, week-to-week trends, and seasonal themes in an easy to understand way.
Just a half-century ago, long-range prediction was the relative guesswork of climate soothsayers. Now, rich climate datasets generated on supercomputers around the world underpin reasonably good projections of the weather during the months to come.
These datasets are now seeing their potential maximized by machine and deep learning, as data-driven techniques can almost instantly detect relationships and make linkages that the human brain can’t. We’ll be hearing more and more about this type of artificial intelligence in the years to come and not just in weather and climate.
Long range predictions aren’t perfect and likely never will be; however, many sectors contract services for long range outlooks to help with planning, decision making, and strategy. This could involve a department store having a larger or smaller stock of snowblowers based on climate expectations. It could also involve the strategic placement of goods, like rock salt, in regions that are expecting a rougher winter season. It could also be a farmer preparing him or herself for a drought.
I can only dream of where the science will be in century from now. My hope is that a climate scientist from the year 2121 stumbles upon this post and laughs about how “primitive” it is. That would imply a lot of progress.
As for predicting Hudson Valley snow days, there’s a 100% chance I’ll be with you every step of the way this winter 💯
Find the links to all my social media channels at: https://linktr.ee/bennollweather
If you found this post interesting, helpful, or just want to give my forecasts a boost, please consider donating or grabbing some merch by following the links below 🙏


